Fijian vs Chickasaw Median Household Income
COMPARE
Fijian
Chickasaw
Median Household Income
Median Household Income Comparison
Fijians
Chickasaw
$74,205
MEDIAN HOUSEHOLD INCOME
0.1/ 100
METRIC RATING
289th/ 347
METRIC RANK
$70,005
MEDIAN HOUSEHOLD INCOME
0.0/ 100
METRIC RATING
321st/ 347
METRIC RANK
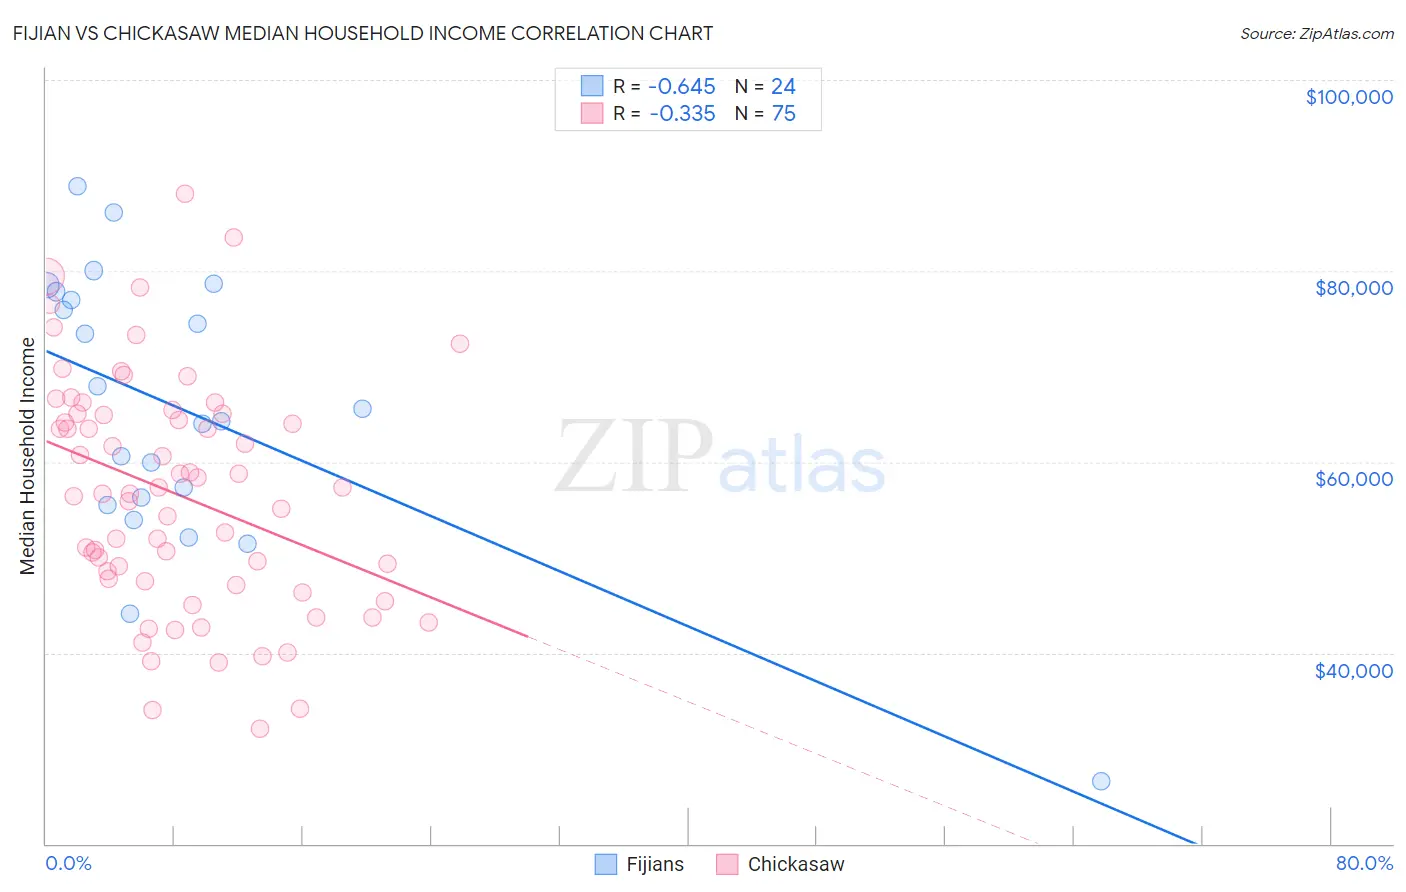
Fijian vs Chickasaw Median Household Income Correlation Chart
The statistical analysis conducted on geographies consisting of 55,947,302 people shows a significant negative correlation between the proportion of Fijians and median household income in the United States with a correlation coefficient (R) of -0.645 and weighted average of $74,205. Similarly, the statistical analysis conducted on geographies consisting of 147,666,315 people shows a mild negative correlation between the proportion of Chickasaw and median household income in the United States with a correlation coefficient (R) of -0.335 and weighted average of $70,005, a difference of 6.0%.
Median Household Income Correlation Summary
| Measurement | Fijian | Chickasaw |
| Minimum | $26,558 | $32,063 |
| Maximum | $88,892 | $88,105 |
| Range | $62,334 | $56,042 |
| Mean | $65,433 | $56,625 |
| Median | $64,846 | $56,725 |
| Interquartile 25% (IQ1) | $55,875 | $47,447 |
| Interquartile 75% (IQ3) | $77,382 | $65,033 |
| Interquartile Range (IQR) | $21,507 | $17,586 |
| Standard Deviation (Sample) | $14,545 | $12,174 |
| Standard Deviation (Population) | $14,239 | $12,093 |
Similar Demographics by Median Household Income
Demographics Similar to Fijians by Median Household Income
In terms of median household income, the demographic groups most similar to Fijians are Immigrants from Central America ($74,217, a difference of 0.020%), Iroquois ($74,279, a difference of 0.10%), Immigrants from Somalia ($74,300, a difference of 0.13%), Bangladeshi ($74,112, a difference of 0.13%), and Mexican ($74,399, a difference of 0.26%).
| Demographics | Rating | Rank | Median Household Income |
| Central American Indians | 0.1 /100 | #282 | Tragic $74,847 |
| Cree | 0.1 /100 | #283 | Tragic $74,685 |
| Yaqui | 0.1 /100 | #284 | Tragic $74,596 |
| Mexicans | 0.1 /100 | #285 | Tragic $74,399 |
| Immigrants | Somalia | 0.1 /100 | #286 | Tragic $74,300 |
| Iroquois | 0.1 /100 | #287 | Tragic $74,279 |
| Immigrants | Central America | 0.1 /100 | #288 | Tragic $74,217 |
| Fijians | 0.1 /100 | #289 | Tragic $74,205 |
| Bangladeshis | 0.1 /100 | #290 | Tragic $74,112 |
| Hispanics or Latinos | 0.1 /100 | #291 | Tragic $73,823 |
| Comanche | 0.1 /100 | #292 | Tragic $73,747 |
| Immigrants | Cabo Verde | 0.1 /100 | #293 | Tragic $73,515 |
| Blackfeet | 0.1 /100 | #294 | Tragic $73,509 |
| Cubans | 0.1 /100 | #295 | Tragic $73,392 |
| Haitians | 0.1 /100 | #296 | Tragic $73,306 |
Demographics Similar to Chickasaw by Median Household Income
In terms of median household income, the demographic groups most similar to Chickasaw are Choctaw ($69,947, a difference of 0.080%), Colville ($70,094, a difference of 0.13%), Immigrants from Dominican Republic ($70,208, a difference of 0.29%), Bahamian ($69,726, a difference of 0.40%), and Yup'ik ($69,695, a difference of 0.45%).
| Demographics | Rating | Rank | Median Household Income |
| Dominicans | 0.0 /100 | #314 | Tragic $71,302 |
| Ottawa | 0.0 /100 | #315 | Tragic $70,984 |
| Apache | 0.0 /100 | #316 | Tragic $70,927 |
| Cajuns | 0.0 /100 | #317 | Tragic $70,605 |
| Chippewa | 0.0 /100 | #318 | Tragic $70,539 |
| Immigrants | Dominican Republic | 0.0 /100 | #319 | Tragic $70,208 |
| Colville | 0.0 /100 | #320 | Tragic $70,094 |
| Chickasaw | 0.0 /100 | #321 | Tragic $70,005 |
| Choctaw | 0.0 /100 | #322 | Tragic $69,947 |
| Bahamians | 0.0 /100 | #323 | Tragic $69,726 |
| Yup'ik | 0.0 /100 | #324 | Tragic $69,695 |
| Seminole | 0.0 /100 | #325 | Tragic $69,420 |
| Yuman | 0.0 /100 | #326 | Tragic $68,743 |
| Immigrants | Cuba | 0.0 /100 | #327 | Tragic $68,461 |
| Menominee | 0.0 /100 | #328 | Tragic $68,423 |