Barbadian vs Chickasaw Median Household Income
COMPARE
Barbadian
Chickasaw
Median Household Income
Median Household Income Comparison
Barbadians
Chickasaw
$79,664
MEDIAN HOUSEHOLD INCOME
3.0/ 100
METRIC RATING
238th/ 347
METRIC RANK
$70,005
MEDIAN HOUSEHOLD INCOME
0.0/ 100
METRIC RATING
321st/ 347
METRIC RANK
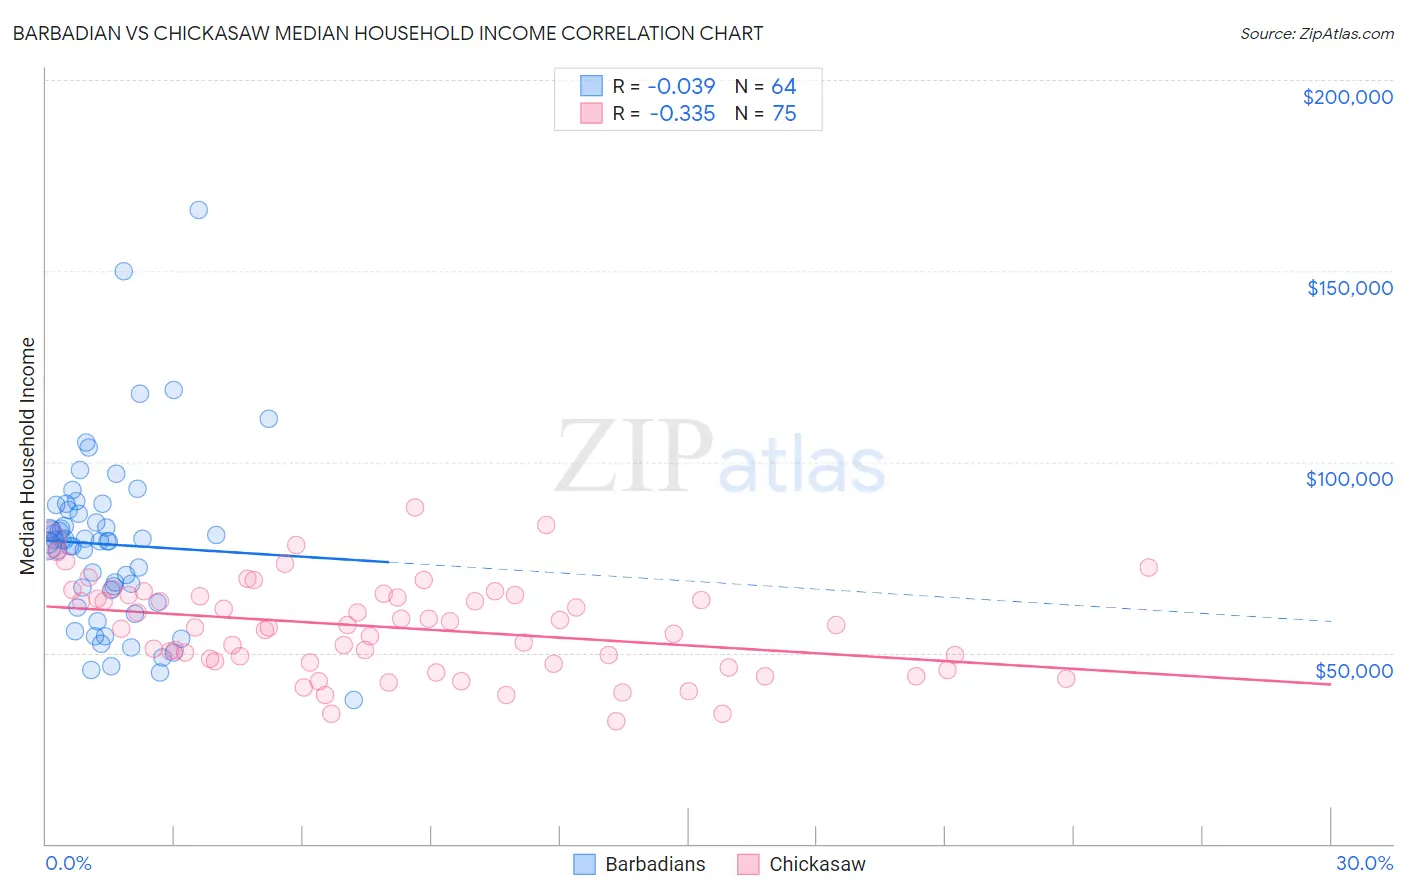
Barbadian vs Chickasaw Median Household Income Correlation Chart
The statistical analysis conducted on geographies consisting of 141,253,267 people shows no correlation between the proportion of Barbadians and median household income in the United States with a correlation coefficient (R) of -0.039 and weighted average of $79,664. Similarly, the statistical analysis conducted on geographies consisting of 147,666,315 people shows a mild negative correlation between the proportion of Chickasaw and median household income in the United States with a correlation coefficient (R) of -0.335 and weighted average of $70,005, a difference of 13.8%.
Median Household Income Correlation Summary
| Measurement | Barbadian | Chickasaw |
| Minimum | $37,500 | $32,063 |
| Maximum | $166,111 | $88,105 |
| Range | $128,611 | $56,042 |
| Mean | $78,382 | $56,625 |
| Median | $79,225 | $56,725 |
| Interquartile 25% (IQ1) | $64,694 | $47,447 |
| Interquartile 75% (IQ3) | $86,916 | $65,033 |
| Interquartile Range (IQR) | $22,222 | $17,586 |
| Standard Deviation (Sample) | $22,744 | $12,174 |
| Standard Deviation (Population) | $22,565 | $12,093 |
Similar Demographics by Median Household Income
Demographics Similar to Barbadians by Median Household Income
In terms of median household income, the demographic groups most similar to Barbadians are Nicaraguan ($79,737, a difference of 0.090%), Alaska Native ($79,509, a difference of 0.20%), Immigrants from Western Africa ($79,490, a difference of 0.22%), Immigrants from Bosnia and Herzegovina ($79,888, a difference of 0.28%), and Nonimmigrants ($79,429, a difference of 0.30%).
| Demographics | Rating | Rank | Median Household Income |
| Trinidadians and Tobagonians | 4.7 /100 | #231 | Tragic $80,402 |
| Immigrants | Trinidad and Tobago | 4.6 /100 | #232 | Tragic $80,373 |
| Immigrants | Azores | 4.5 /100 | #233 | Tragic $80,357 |
| Immigrants | Ecuador | 4.5 /100 | #234 | Tragic $80,341 |
| Immigrants | Guyana | 4.5 /100 | #235 | Tragic $80,324 |
| Immigrants | Bosnia and Herzegovina | 3.4 /100 | #236 | Tragic $79,888 |
| Nicaraguans | 3.1 /100 | #237 | Tragic $79,737 |
| Barbadians | 3.0 /100 | #238 | Tragic $79,664 |
| Alaska Natives | 2.7 /100 | #239 | Tragic $79,509 |
| Immigrants | Western Africa | 2.7 /100 | #240 | Tragic $79,490 |
| Immigrants | Nonimmigrants | 2.6 /100 | #241 | Tragic $79,429 |
| Immigrants | Sudan | 2.1 /100 | #242 | Tragic $79,103 |
| Immigrants | Barbados | 1.9 /100 | #243 | Tragic $78,989 |
| Marshallese | 1.9 /100 | #244 | Tragic $78,930 |
| Inupiat | 1.8 /100 | #245 | Tragic $78,841 |
Demographics Similar to Chickasaw by Median Household Income
In terms of median household income, the demographic groups most similar to Chickasaw are Choctaw ($69,947, a difference of 0.080%), Colville ($70,094, a difference of 0.13%), Immigrants from Dominican Republic ($70,208, a difference of 0.29%), Bahamian ($69,726, a difference of 0.40%), and Yup'ik ($69,695, a difference of 0.45%).
| Demographics | Rating | Rank | Median Household Income |
| Dominicans | 0.0 /100 | #314 | Tragic $71,302 |
| Ottawa | 0.0 /100 | #315 | Tragic $70,984 |
| Apache | 0.0 /100 | #316 | Tragic $70,927 |
| Cajuns | 0.0 /100 | #317 | Tragic $70,605 |
| Chippewa | 0.0 /100 | #318 | Tragic $70,539 |
| Immigrants | Dominican Republic | 0.0 /100 | #319 | Tragic $70,208 |
| Colville | 0.0 /100 | #320 | Tragic $70,094 |
| Chickasaw | 0.0 /100 | #321 | Tragic $70,005 |
| Choctaw | 0.0 /100 | #322 | Tragic $69,947 |
| Bahamians | 0.0 /100 | #323 | Tragic $69,726 |
| Yup'ik | 0.0 /100 | #324 | Tragic $69,695 |
| Seminole | 0.0 /100 | #325 | Tragic $69,420 |
| Yuman | 0.0 /100 | #326 | Tragic $68,743 |
| Immigrants | Cuba | 0.0 /100 | #327 | Tragic $68,461 |
| Menominee | 0.0 /100 | #328 | Tragic $68,423 |