Ottawa vs Chickasaw Median Female Earnings
COMPARE
Ottawa
Chickasaw
Median Female Earnings
Median Female Earnings Comparison
Ottawa
Chickasaw
$33,378
MEDIAN FEMALE EARNINGS
0.0/ 100
METRIC RATING
336th/ 347
METRIC RANK
$34,414
MEDIAN FEMALE EARNINGS
0.0/ 100
METRIC RATING
322nd/ 347
METRIC RANK
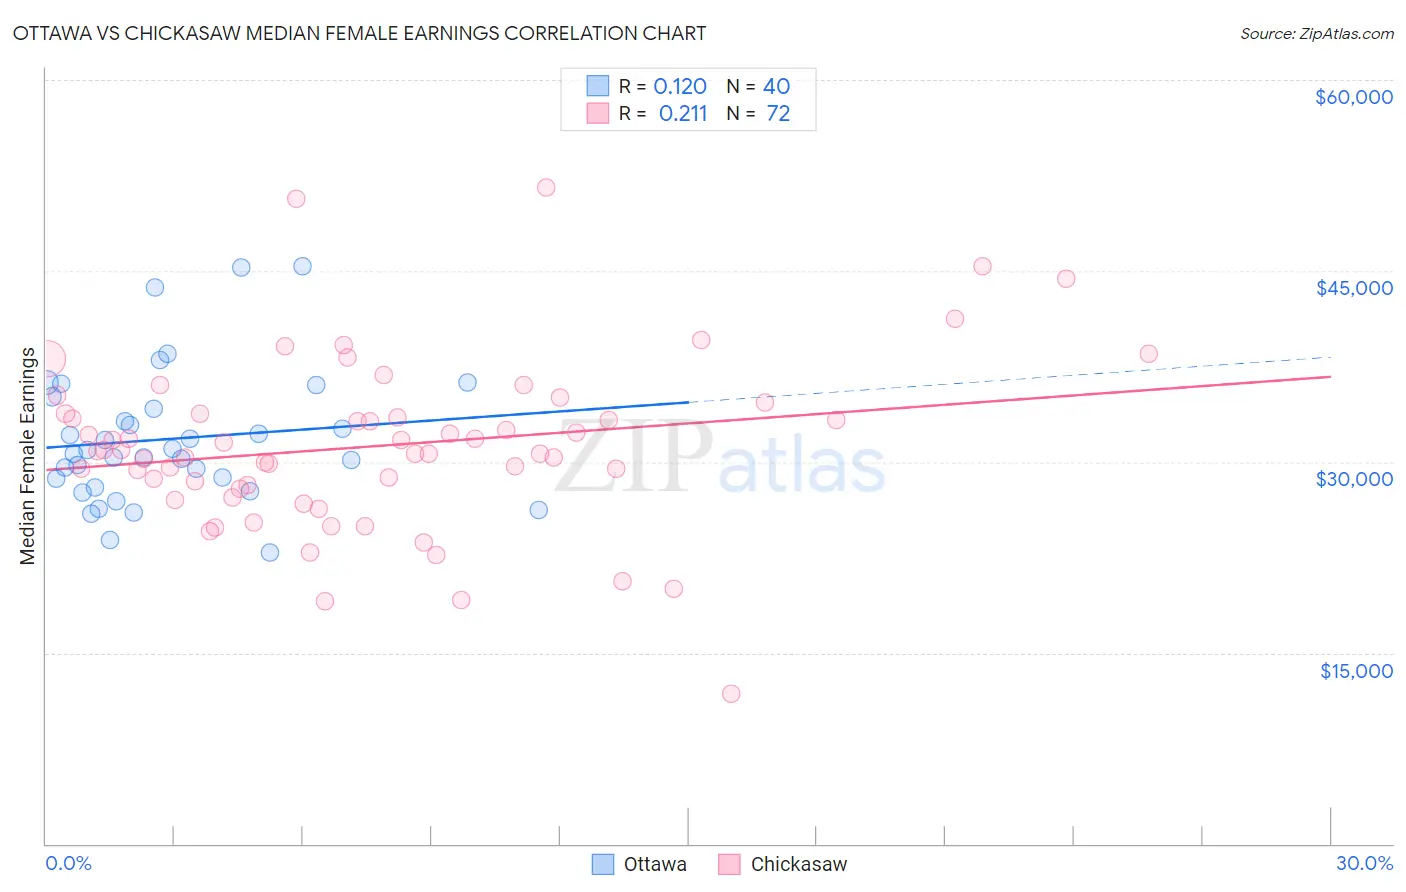
Ottawa vs Chickasaw Median Female Earnings Correlation Chart
The statistical analysis conducted on geographies consisting of 49,946,188 people shows a poor positive correlation between the proportion of Ottawa and median female earnings in the United States with a correlation coefficient (R) of 0.120 and weighted average of $33,378. Similarly, the statistical analysis conducted on geographies consisting of 147,680,530 people shows a weak positive correlation between the proportion of Chickasaw and median female earnings in the United States with a correlation coefficient (R) of 0.211 and weighted average of $34,414, a difference of 3.1%.
Median Female Earnings Correlation Summary
| Measurement | Ottawa | Chickasaw |
| Minimum | $22,891 | $11,797 |
| Maximum | $45,375 | $51,543 |
| Range | $22,484 | $39,746 |
| Mean | $31,817 | $31,266 |
| Median | $30,771 | $30,877 |
| Interquartile 25% (IQ1) | $28,352 | $28,026 |
| Interquartile 75% (IQ3) | $34,654 | $33,779 |
| Interquartile Range (IQR) | $6,302 | $5,753 |
| Standard Deviation (Sample) | $5,248 | $6,735 |
| Standard Deviation (Population) | $5,182 | $6,688 |
Demographics Similar to Ottawa and Chickasaw by Median Female Earnings
In terms of median female earnings, the demographic groups most similar to Ottawa are Yakama ($33,354, a difference of 0.070%), Creek ($33,437, a difference of 0.18%), Immigrants from Cuba ($33,291, a difference of 0.26%), Immigrants from Mexico ($33,236, a difference of 0.43%), and Spanish American Indian ($33,625, a difference of 0.74%). Similarly, the demographic groups most similar to Chickasaw are Hispanic or Latino ($34,421, a difference of 0.020%), Seminole ($34,385, a difference of 0.080%), Immigrants from Congo ($34,317, a difference of 0.28%), Immigrants from Honduras ($34,647, a difference of 0.68%), and Shoshone ($34,677, a difference of 0.76%).
| Demographics | Rating | Rank | Median Female Earnings |
| Shoshone | 0.0 /100 | #319 | Tragic $34,677 |
| Immigrants | Honduras | 0.0 /100 | #320 | Tragic $34,647 |
| Hispanics or Latinos | 0.0 /100 | #321 | Tragic $34,421 |
| Chickasaw | 0.0 /100 | #322 | Tragic $34,414 |
| Seminole | 0.0 /100 | #323 | Tragic $34,385 |
| Immigrants | Congo | 0.0 /100 | #324 | Tragic $34,317 |
| Dutch West Indians | 0.0 /100 | #325 | Tragic $34,106 |
| Kiowa | 0.0 /100 | #326 | Tragic $34,074 |
| Cajuns | 0.0 /100 | #327 | Tragic $34,034 |
| Immigrants | Central America | 0.0 /100 | #328 | Tragic $33,953 |
| Hopi | 0.0 /100 | #329 | Tragic $33,932 |
| Menominee | 0.0 /100 | #330 | Tragic $33,894 |
| Natives/Alaskans | 0.0 /100 | #331 | Tragic $33,806 |
| Choctaw | 0.0 /100 | #332 | Tragic $33,775 |
| Mexicans | 0.0 /100 | #333 | Tragic $33,664 |
| Spanish American Indians | 0.0 /100 | #334 | Tragic $33,625 |
| Creek | 0.0 /100 | #335 | Tragic $33,437 |
| Ottawa | 0.0 /100 | #336 | Tragic $33,378 |
| Yakama | 0.0 /100 | #337 | Tragic $33,354 |
| Immigrants | Cuba | 0.0 /100 | #338 | Tragic $33,291 |
| Immigrants | Mexico | 0.0 /100 | #339 | Tragic $33,236 |