Ottawa vs Basque Median Female Earnings
COMPARE
Ottawa
Basque
Median Female Earnings
Median Female Earnings Comparison
Ottawa
Basques
$33,378
MEDIAN FEMALE EARNINGS
0.0/ 100
METRIC RATING
336th/ 347
METRIC RANK
$38,352
MEDIAN FEMALE EARNINGS
5.7/ 100
METRIC RATING
230th/ 347
METRIC RANK
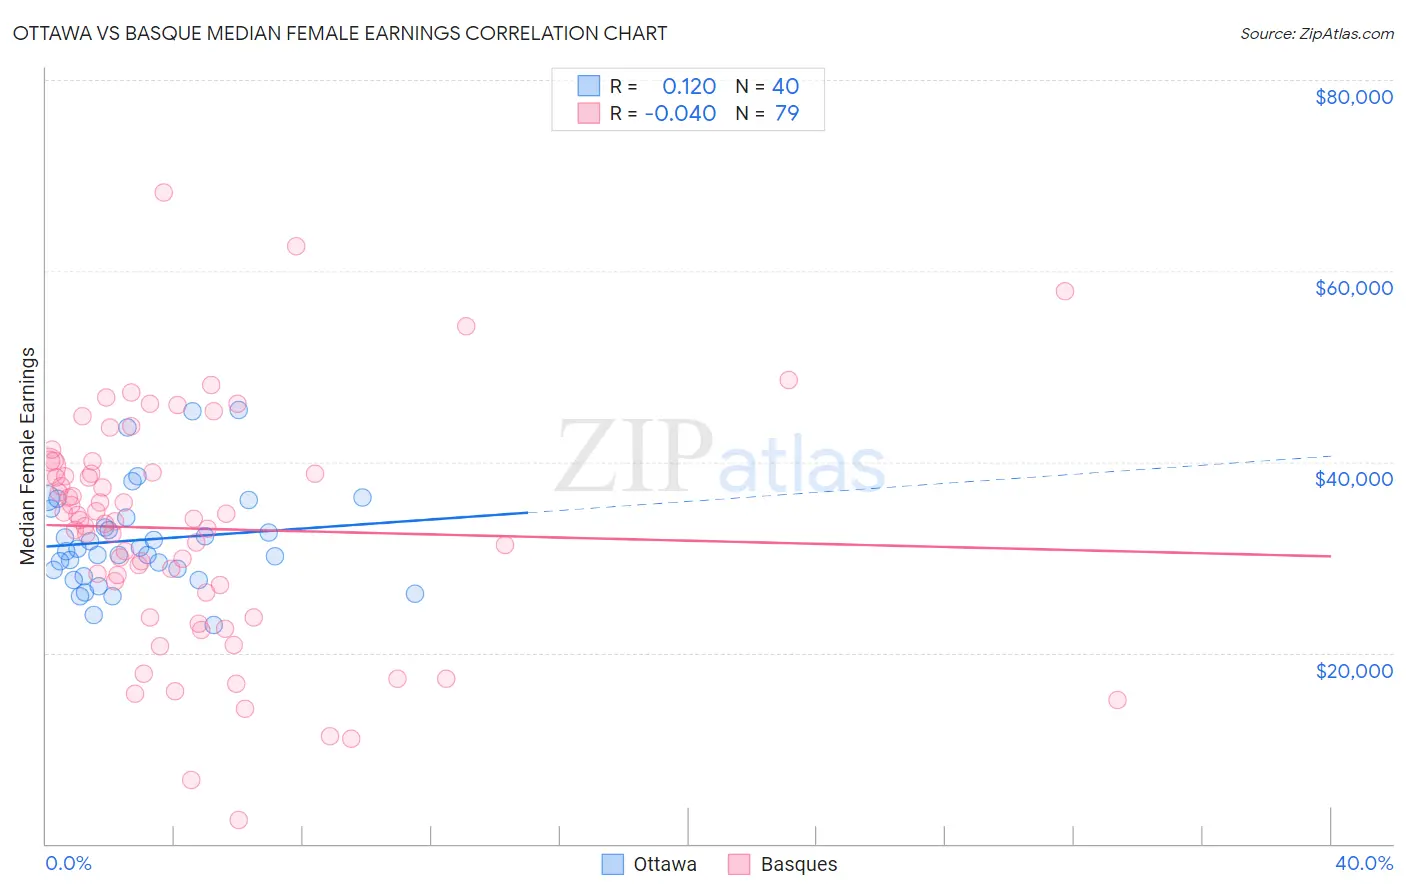
Ottawa vs Basque Median Female Earnings Correlation Chart
The statistical analysis conducted on geographies consisting of 49,946,188 people shows a poor positive correlation between the proportion of Ottawa and median female earnings in the United States with a correlation coefficient (R) of 0.120 and weighted average of $33,378. Similarly, the statistical analysis conducted on geographies consisting of 165,731,854 people shows no correlation between the proportion of Basques and median female earnings in the United States with a correlation coefficient (R) of -0.040 and weighted average of $38,352, a difference of 14.9%.
Median Female Earnings Correlation Summary
| Measurement | Ottawa | Basque |
| Minimum | $22,891 | $2,499 |
| Maximum | $45,375 | $68,214 |
| Range | $22,484 | $65,715 |
| Mean | $31,817 | $33,005 |
| Median | $30,771 | $33,892 |
| Interquartile 25% (IQ1) | $28,352 | $26,382 |
| Interquartile 75% (IQ3) | $34,654 | $39,564 |
| Interquartile Range (IQR) | $6,302 | $13,182 |
| Standard Deviation (Sample) | $5,248 | $12,137 |
| Standard Deviation (Population) | $5,182 | $12,060 |
Similar Demographics by Median Female Earnings
Demographics Similar to Ottawa by Median Female Earnings
In terms of median female earnings, the demographic groups most similar to Ottawa are Yakama ($33,354, a difference of 0.070%), Creek ($33,437, a difference of 0.18%), Immigrants from Cuba ($33,291, a difference of 0.26%), Immigrants from Mexico ($33,236, a difference of 0.43%), and Tohono O'odham ($33,205, a difference of 0.52%).
| Demographics | Rating | Rank | Median Female Earnings |
| Hopi | 0.0 /100 | #329 | Tragic $33,932 |
| Menominee | 0.0 /100 | #330 | Tragic $33,894 |
| Natives/Alaskans | 0.0 /100 | #331 | Tragic $33,806 |
| Choctaw | 0.0 /100 | #332 | Tragic $33,775 |
| Mexicans | 0.0 /100 | #333 | Tragic $33,664 |
| Spanish American Indians | 0.0 /100 | #334 | Tragic $33,625 |
| Creek | 0.0 /100 | #335 | Tragic $33,437 |
| Ottawa | 0.0 /100 | #336 | Tragic $33,378 |
| Yakama | 0.0 /100 | #337 | Tragic $33,354 |
| Immigrants | Cuba | 0.0 /100 | #338 | Tragic $33,291 |
| Immigrants | Mexico | 0.0 /100 | #339 | Tragic $33,236 |
| Tohono O'odham | 0.0 /100 | #340 | Tragic $33,205 |
| Navajo | 0.0 /100 | #341 | Tragic $33,046 |
| Yup'ik | 0.0 /100 | #342 | Tragic $32,730 |
| Pueblo | 0.0 /100 | #343 | Tragic $32,564 |
Demographics Similar to Basques by Median Female Earnings
In terms of median female earnings, the demographic groups most similar to Basques are Somali ($38,333, a difference of 0.050%), Belgian ($38,382, a difference of 0.080%), Subsaharan African ($38,391, a difference of 0.10%), Scottish ($38,397, a difference of 0.12%), and Scandinavian ($38,306, a difference of 0.12%).
| Demographics | Rating | Rank | Median Female Earnings |
| Immigrants | Sudan | 7.8 /100 | #223 | Tragic $38,511 |
| Native Hawaiians | 7.1 /100 | #224 | Tragic $38,461 |
| French | 7.0 /100 | #225 | Tragic $38,457 |
| French Canadians | 6.8 /100 | #226 | Tragic $38,436 |
| Scottish | 6.3 /100 | #227 | Tragic $38,397 |
| Sub-Saharan Africans | 6.2 /100 | #228 | Tragic $38,391 |
| Belgians | 6.1 /100 | #229 | Tragic $38,382 |
| Basques | 5.7 /100 | #230 | Tragic $38,352 |
| Somalis | 5.5 /100 | #231 | Tragic $38,333 |
| Scandinavians | 5.2 /100 | #232 | Tragic $38,306 |
| Tongans | 5.1 /100 | #233 | Tragic $38,288 |
| Celtics | 5.0 /100 | #234 | Tragic $38,283 |
| Sudanese | 4.4 /100 | #235 | Tragic $38,215 |
| Liberians | 4.4 /100 | #236 | Tragic $38,215 |
| Immigrants | Cabo Verde | 4.3 /100 | #237 | Tragic $38,208 |