Ottawa vs Immigrants from Southern Europe Median Female Earnings
COMPARE
Ottawa
Immigrants from Southern Europe
Median Female Earnings
Median Female Earnings Comparison
Ottawa
Immigrants from Southern Europe
$33,378
MEDIAN FEMALE EARNINGS
0.0/ 100
METRIC RATING
336th/ 347
METRIC RANK
$42,275
MEDIAN FEMALE EARNINGS
99.5/ 100
METRIC RATING
81st/ 347
METRIC RANK
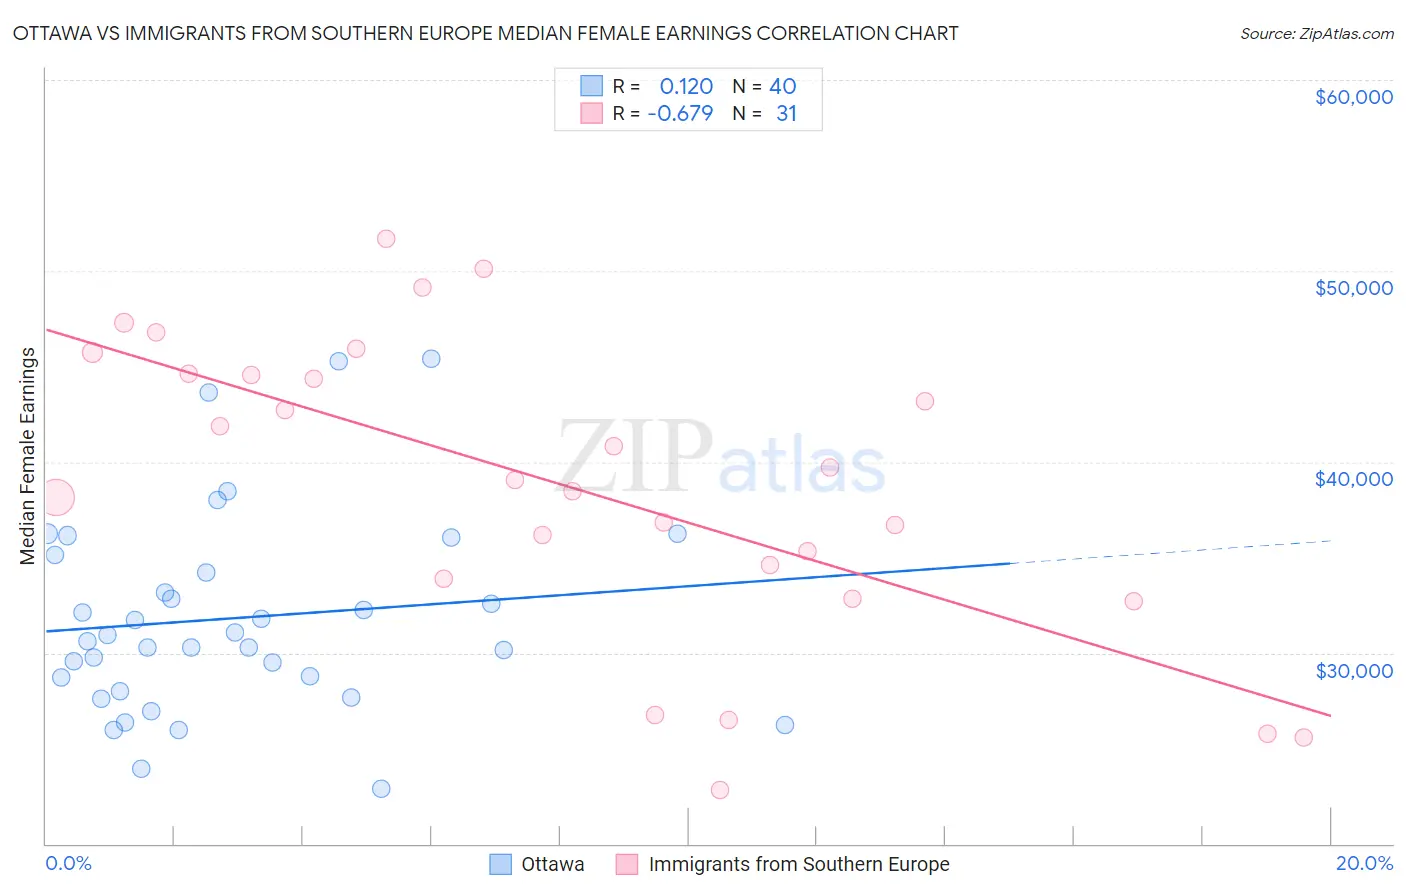
Ottawa vs Immigrants from Southern Europe Median Female Earnings Correlation Chart
The statistical analysis conducted on geographies consisting of 49,946,188 people shows a poor positive correlation between the proportion of Ottawa and median female earnings in the United States with a correlation coefficient (R) of 0.120 and weighted average of $33,378. Similarly, the statistical analysis conducted on geographies consisting of 402,600,797 people shows a significant negative correlation between the proportion of Immigrants from Southern Europe and median female earnings in the United States with a correlation coefficient (R) of -0.679 and weighted average of $42,275, a difference of 26.7%.
Median Female Earnings Correlation Summary
| Measurement | Ottawa | Immigrants from Southern Europe |
| Minimum | $22,891 | $22,783 |
| Maximum | $45,375 | $51,661 |
| Range | $22,484 | $28,878 |
| Mean | $31,817 | $38,726 |
| Median | $30,771 | $39,052 |
| Interquartile 25% (IQ1) | $28,352 | $33,886 |
| Interquartile 75% (IQ3) | $34,654 | $44,613 |
| Interquartile Range (IQR) | $6,302 | $10,727 |
| Standard Deviation (Sample) | $5,248 | $7,794 |
| Standard Deviation (Population) | $5,182 | $7,668 |
Similar Demographics by Median Female Earnings
Demographics Similar to Ottawa by Median Female Earnings
In terms of median female earnings, the demographic groups most similar to Ottawa are Yakama ($33,354, a difference of 0.070%), Creek ($33,437, a difference of 0.18%), Immigrants from Cuba ($33,291, a difference of 0.26%), Immigrants from Mexico ($33,236, a difference of 0.43%), and Tohono O'odham ($33,205, a difference of 0.52%).
| Demographics | Rating | Rank | Median Female Earnings |
| Hopi | 0.0 /100 | #329 | Tragic $33,932 |
| Menominee | 0.0 /100 | #330 | Tragic $33,894 |
| Natives/Alaskans | 0.0 /100 | #331 | Tragic $33,806 |
| Choctaw | 0.0 /100 | #332 | Tragic $33,775 |
| Mexicans | 0.0 /100 | #333 | Tragic $33,664 |
| Spanish American Indians | 0.0 /100 | #334 | Tragic $33,625 |
| Creek | 0.0 /100 | #335 | Tragic $33,437 |
| Ottawa | 0.0 /100 | #336 | Tragic $33,378 |
| Yakama | 0.0 /100 | #337 | Tragic $33,354 |
| Immigrants | Cuba | 0.0 /100 | #338 | Tragic $33,291 |
| Immigrants | Mexico | 0.0 /100 | #339 | Tragic $33,236 |
| Tohono O'odham | 0.0 /100 | #340 | Tragic $33,205 |
| Navajo | 0.0 /100 | #341 | Tragic $33,046 |
| Yup'ik | 0.0 /100 | #342 | Tragic $32,730 |
| Pueblo | 0.0 /100 | #343 | Tragic $32,564 |
Demographics Similar to Immigrants from Southern Europe by Median Female Earnings
In terms of median female earnings, the demographic groups most similar to Immigrants from Southern Europe are Immigrants from Moldova ($42,304, a difference of 0.070%), Immigrants from Morocco ($42,229, a difference of 0.11%), Immigrants from Sierra Leone ($42,214, a difference of 0.14%), Greek ($42,336, a difference of 0.15%), and Armenian ($42,212, a difference of 0.15%).
| Demographics | Rating | Rank | Median Female Earnings |
| Immigrants | South Africa | 99.7 /100 | #74 | Exceptional $42,508 |
| New Zealanders | 99.7 /100 | #75 | Exceptional $42,446 |
| Immigrants | Italy | 99.7 /100 | #76 | Exceptional $42,446 |
| Immigrants | Albania | 99.6 /100 | #77 | Exceptional $42,388 |
| Immigrants | Kazakhstan | 99.6 /100 | #78 | Exceptional $42,386 |
| Greeks | 99.6 /100 | #79 | Exceptional $42,336 |
| Immigrants | Moldova | 99.6 /100 | #80 | Exceptional $42,304 |
| Immigrants | Southern Europe | 99.5 /100 | #81 | Exceptional $42,275 |
| Immigrants | Morocco | 99.5 /100 | #82 | Exceptional $42,229 |
| Immigrants | Sierra Leone | 99.5 /100 | #83 | Exceptional $42,214 |
| Armenians | 99.5 /100 | #84 | Exceptional $42,212 |
| Laotians | 99.4 /100 | #85 | Exceptional $42,133 |
| Immigrants | St. Vincent and the Grenadines | 99.3 /100 | #86 | Exceptional $42,108 |
| Lithuanians | 99.3 /100 | #87 | Exceptional $42,108 |
| Immigrants | Northern Africa | 99.3 /100 | #88 | Exceptional $42,084 |