Okinawan vs Immigrants from Uzbekistan Per Capita Income
COMPARE
Okinawan
Immigrants from Uzbekistan
Per Capita Income
Per Capita Income Comparison
Okinawans
Immigrants from Uzbekistan
$55,817
PER CAPITA INCOME
100.0/ 100
METRIC RATING
10th/ 347
METRIC RANK
$46,929
PER CAPITA INCOME
97.5/ 100
METRIC RATING
101st/ 347
METRIC RANK
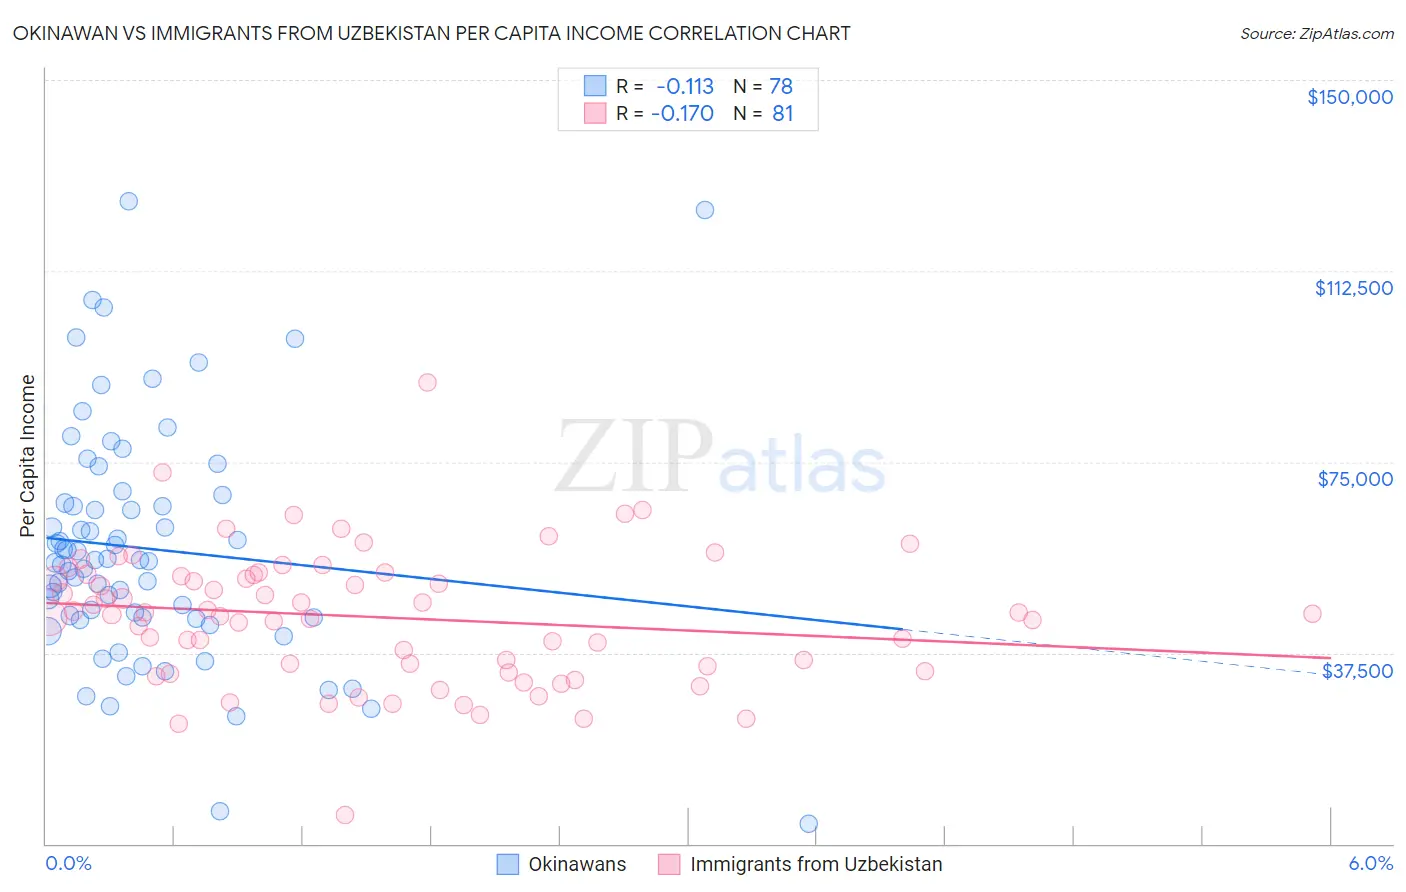
Okinawan vs Immigrants from Uzbekistan Per Capita Income Correlation Chart
The statistical analysis conducted on geographies consisting of 73,745,153 people shows a poor negative correlation between the proportion of Okinawans and per capita income in the United States with a correlation coefficient (R) of -0.113 and weighted average of $55,817. Similarly, the statistical analysis conducted on geographies consisting of 118,766,454 people shows a poor negative correlation between the proportion of Immigrants from Uzbekistan and per capita income in the United States with a correlation coefficient (R) of -0.170 and weighted average of $46,929, a difference of 18.9%.
Per Capita Income Correlation Summary
| Measurement | Okinawan | Immigrants from Uzbekistan |
| Minimum | $4,017 | $5,747 |
| Maximum | $126,204 | $90,679 |
| Range | $122,187 | $84,932 |
| Mean | $57,948 | $44,513 |
| Median | $55,509 | $45,080 |
| Interquartile 25% (IQ1) | $44,396 | $34,402 |
| Interquartile 75% (IQ3) | $66,910 | $52,838 |
| Interquartile Range (IQR) | $22,513 | $18,436 |
| Standard Deviation (Sample) | $23,213 | $13,145 |
| Standard Deviation (Population) | $23,064 | $13,064 |
Similar Demographics by Per Capita Income
Demographics Similar to Okinawans by Per Capita Income
In terms of per capita income, the demographic groups most similar to Okinawans are Eastern European ($55,780, a difference of 0.070%), Immigrants from Sweden ($55,582, a difference of 0.42%), Immigrants from India ($55,268, a difference of 0.99%), Immigrants from Belgium ($55,082, a difference of 1.3%), and Immigrants from Ireland ($56,584, a difference of 1.4%).
| Demographics | Rating | Rank | Per Capita Income |
| Immigrants | Singapore | 100.0 /100 | #3 | Exceptional $58,353 |
| Immigrants | Australia | 100.0 /100 | #4 | Exceptional $57,953 |
| Immigrants | Iran | 100.0 /100 | #5 | Exceptional $57,759 |
| Immigrants | Taiwan | 100.0 /100 | #6 | Exceptional $57,742 |
| Immigrants | Israel | 100.0 /100 | #7 | Exceptional $57,384 |
| Immigrants | Hong Kong | 100.0 /100 | #8 | Exceptional $56,709 |
| Immigrants | Ireland | 100.0 /100 | #9 | Exceptional $56,584 |
| Okinawans | 100.0 /100 | #10 | Exceptional $55,817 |
| Eastern Europeans | 100.0 /100 | #11 | Exceptional $55,780 |
| Immigrants | Sweden | 100.0 /100 | #12 | Exceptional $55,582 |
| Immigrants | India | 100.0 /100 | #13 | Exceptional $55,268 |
| Immigrants | Belgium | 100.0 /100 | #14 | Exceptional $55,082 |
| Cypriots | 100.0 /100 | #15 | Exceptional $54,899 |
| Immigrants | Switzerland | 100.0 /100 | #16 | Exceptional $54,866 |
| Immigrants | France | 100.0 /100 | #17 | Exceptional $54,557 |
Demographics Similar to Immigrants from Uzbekistan by Per Capita Income
In terms of per capita income, the demographic groups most similar to Immigrants from Uzbekistan are Immigrants from Lebanon ($46,938, a difference of 0.020%), Immigrants from Western Asia ($46,876, a difference of 0.11%), Syrian ($46,837, a difference of 0.20%), Laotian ($47,041, a difference of 0.24%), and Immigrants from Pakistan ($47,084, a difference of 0.33%).
| Demographics | Rating | Rank | Per Capita Income |
| Albanians | 98.5 /100 | #94 | Exceptional $47,379 |
| Immigrants | Egypt | 98.5 /100 | #95 | Exceptional $47,361 |
| Alsatians | 98.3 /100 | #96 | Exceptional $47,284 |
| Carpatho Rusyns | 98.2 /100 | #97 | Exceptional $47,248 |
| Immigrants | Pakistan | 97.9 /100 | #98 | Exceptional $47,084 |
| Laotians | 97.8 /100 | #99 | Exceptional $47,041 |
| Immigrants | Lebanon | 97.5 /100 | #100 | Exceptional $46,938 |
| Immigrants | Uzbekistan | 97.5 /100 | #101 | Exceptional $46,929 |
| Immigrants | Western Asia | 97.4 /100 | #102 | Exceptional $46,876 |
| Syrians | 97.2 /100 | #103 | Exceptional $46,837 |
| Brazilians | 96.8 /100 | #104 | Exceptional $46,700 |
| British | 96.3 /100 | #105 | Exceptional $46,571 |
| Ethiopians | 96.3 /100 | #106 | Exceptional $46,569 |
| Serbians | 96.2 /100 | #107 | Exceptional $46,551 |
| Immigrants | Kuwait | 96.2 /100 | #108 | Exceptional $46,543 |