Mexican vs Immigrants from Uzbekistan Per Capita Income
COMPARE
Mexican
Immigrants from Uzbekistan
Per Capita Income
Per Capita Income Comparison
Mexicans
Immigrants from Uzbekistan
$34,559
PER CAPITA INCOME
0.0/ 100
METRIC RATING
329th/ 347
METRIC RANK
$46,929
PER CAPITA INCOME
97.5/ 100
METRIC RATING
101st/ 347
METRIC RANK
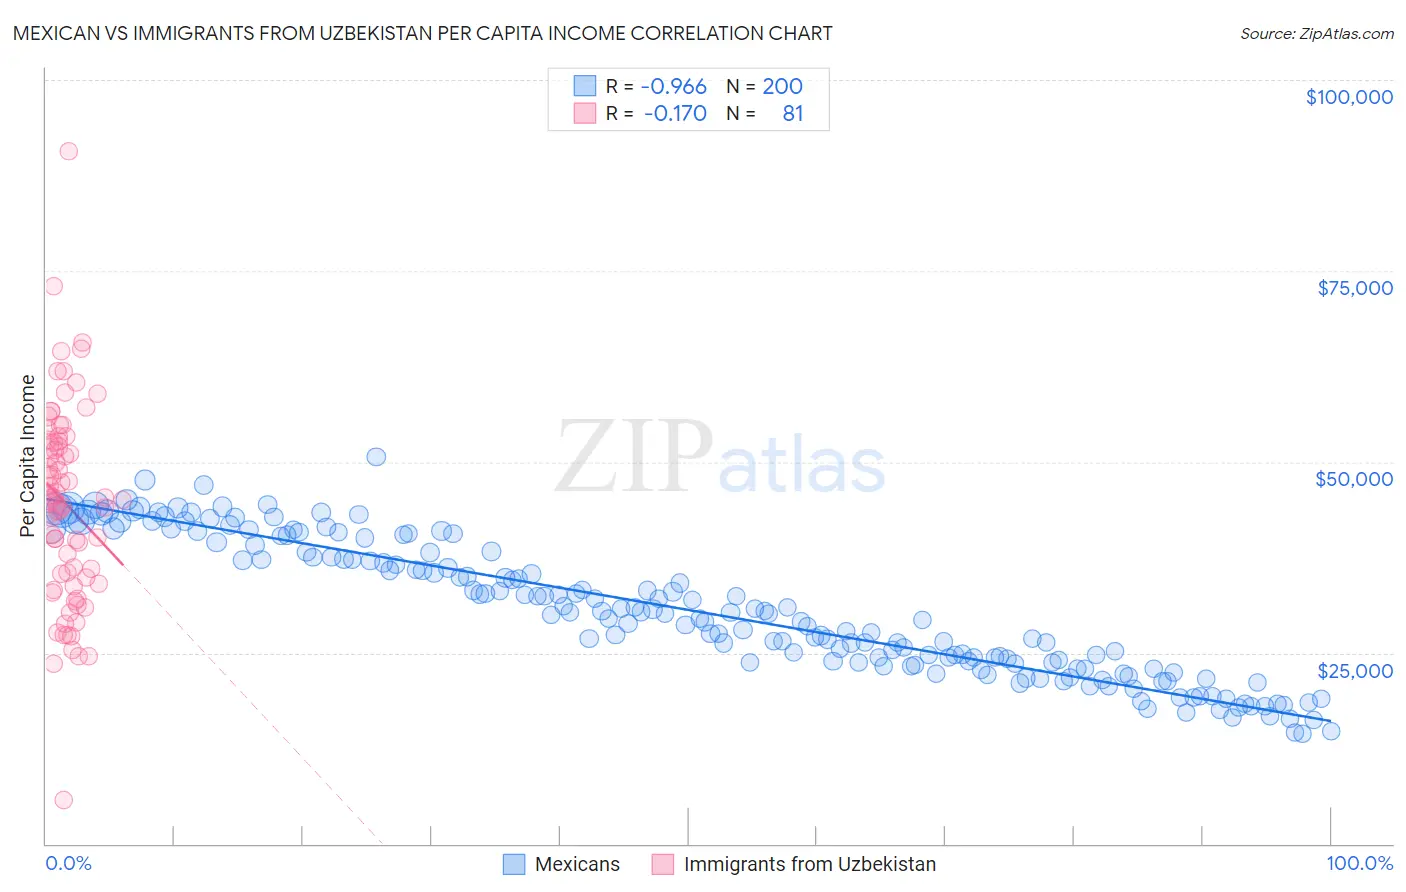
Mexican vs Immigrants from Uzbekistan Per Capita Income Correlation Chart
The statistical analysis conducted on geographies consisting of 565,389,845 people shows a perfect negative correlation between the proportion of Mexicans and per capita income in the United States with a correlation coefficient (R) of -0.966 and weighted average of $34,559. Similarly, the statistical analysis conducted on geographies consisting of 118,766,454 people shows a poor negative correlation between the proportion of Immigrants from Uzbekistan and per capita income in the United States with a correlation coefficient (R) of -0.170 and weighted average of $46,929, a difference of 35.8%.
Per Capita Income Correlation Summary
| Measurement | Mexican | Immigrants from Uzbekistan |
| Minimum | $14,444 | $5,747 |
| Maximum | $50,649 | $90,679 |
| Range | $36,205 | $84,932 |
| Mean | $30,602 | $44,513 |
| Median | $30,143 | $45,080 |
| Interquartile 25% (IQ1) | $23,673 | $34,402 |
| Interquartile 75% (IQ3) | $38,169 | $52,838 |
| Interquartile Range (IQR) | $14,496 | $18,436 |
| Standard Deviation (Sample) | $8,722 | $13,145 |
| Standard Deviation (Population) | $8,700 | $13,064 |
Similar Demographics by Per Capita Income
Demographics Similar to Mexicans by Per Capita Income
In terms of per capita income, the demographic groups most similar to Mexicans are Menominee ($34,578, a difference of 0.060%), Apache ($34,886, a difference of 0.95%), Immigrants from Cuba ($34,910, a difference of 1.0%), Spanish American Indian ($34,195, a difference of 1.1%), and Immigrants from Central America ($34,974, a difference of 1.2%).
| Demographics | Rating | Rank | Per Capita Income |
| Creek | 0.0 /100 | #322 | Tragic $35,546 |
| Cheyenne | 0.0 /100 | #323 | Tragic $35,276 |
| Kiowa | 0.0 /100 | #324 | Tragic $35,102 |
| Immigrants | Central America | 0.0 /100 | #325 | Tragic $34,974 |
| Immigrants | Cuba | 0.0 /100 | #326 | Tragic $34,910 |
| Apache | 0.0 /100 | #327 | Tragic $34,886 |
| Menominee | 0.0 /100 | #328 | Tragic $34,578 |
| Mexicans | 0.0 /100 | #329 | Tragic $34,559 |
| Spanish American Indians | 0.0 /100 | #330 | Tragic $34,195 |
| Immigrants | Mexico | 0.0 /100 | #331 | Tragic $33,931 |
| Sioux | 0.0 /100 | #332 | Tragic $33,921 |
| Immigrants | Yemen | 0.0 /100 | #333 | Tragic $33,696 |
| Natives/Alaskans | 0.0 /100 | #334 | Tragic $33,279 |
| Yuman | 0.0 /100 | #335 | Tragic $33,236 |
| Yakama | 0.0 /100 | #336 | Tragic $33,009 |
Demographics Similar to Immigrants from Uzbekistan by Per Capita Income
In terms of per capita income, the demographic groups most similar to Immigrants from Uzbekistan are Immigrants from Lebanon ($46,938, a difference of 0.020%), Immigrants from Western Asia ($46,876, a difference of 0.11%), Syrian ($46,837, a difference of 0.20%), Laotian ($47,041, a difference of 0.24%), and Immigrants from Pakistan ($47,084, a difference of 0.33%).
| Demographics | Rating | Rank | Per Capita Income |
| Albanians | 98.5 /100 | #94 | Exceptional $47,379 |
| Immigrants | Egypt | 98.5 /100 | #95 | Exceptional $47,361 |
| Alsatians | 98.3 /100 | #96 | Exceptional $47,284 |
| Carpatho Rusyns | 98.2 /100 | #97 | Exceptional $47,248 |
| Immigrants | Pakistan | 97.9 /100 | #98 | Exceptional $47,084 |
| Laotians | 97.8 /100 | #99 | Exceptional $47,041 |
| Immigrants | Lebanon | 97.5 /100 | #100 | Exceptional $46,938 |
| Immigrants | Uzbekistan | 97.5 /100 | #101 | Exceptional $46,929 |
| Immigrants | Western Asia | 97.4 /100 | #102 | Exceptional $46,876 |
| Syrians | 97.2 /100 | #103 | Exceptional $46,837 |
| Brazilians | 96.8 /100 | #104 | Exceptional $46,700 |
| British | 96.3 /100 | #105 | Exceptional $46,571 |
| Ethiopians | 96.3 /100 | #106 | Exceptional $46,569 |
| Serbians | 96.2 /100 | #107 | Exceptional $46,551 |
| Immigrants | Kuwait | 96.2 /100 | #108 | Exceptional $46,543 |