Osage vs Afghan Median Earnings
COMPARE
Osage
Afghan
Median Earnings
Median Earnings Comparison
Osage
Afghans
$42,651
MEDIAN EARNINGS
0.5/ 100
METRIC RATING
270th/ 347
METRIC RANK
$51,112
MEDIAN EARNINGS
99.9/ 100
METRIC RATING
66th/ 347
METRIC RANK
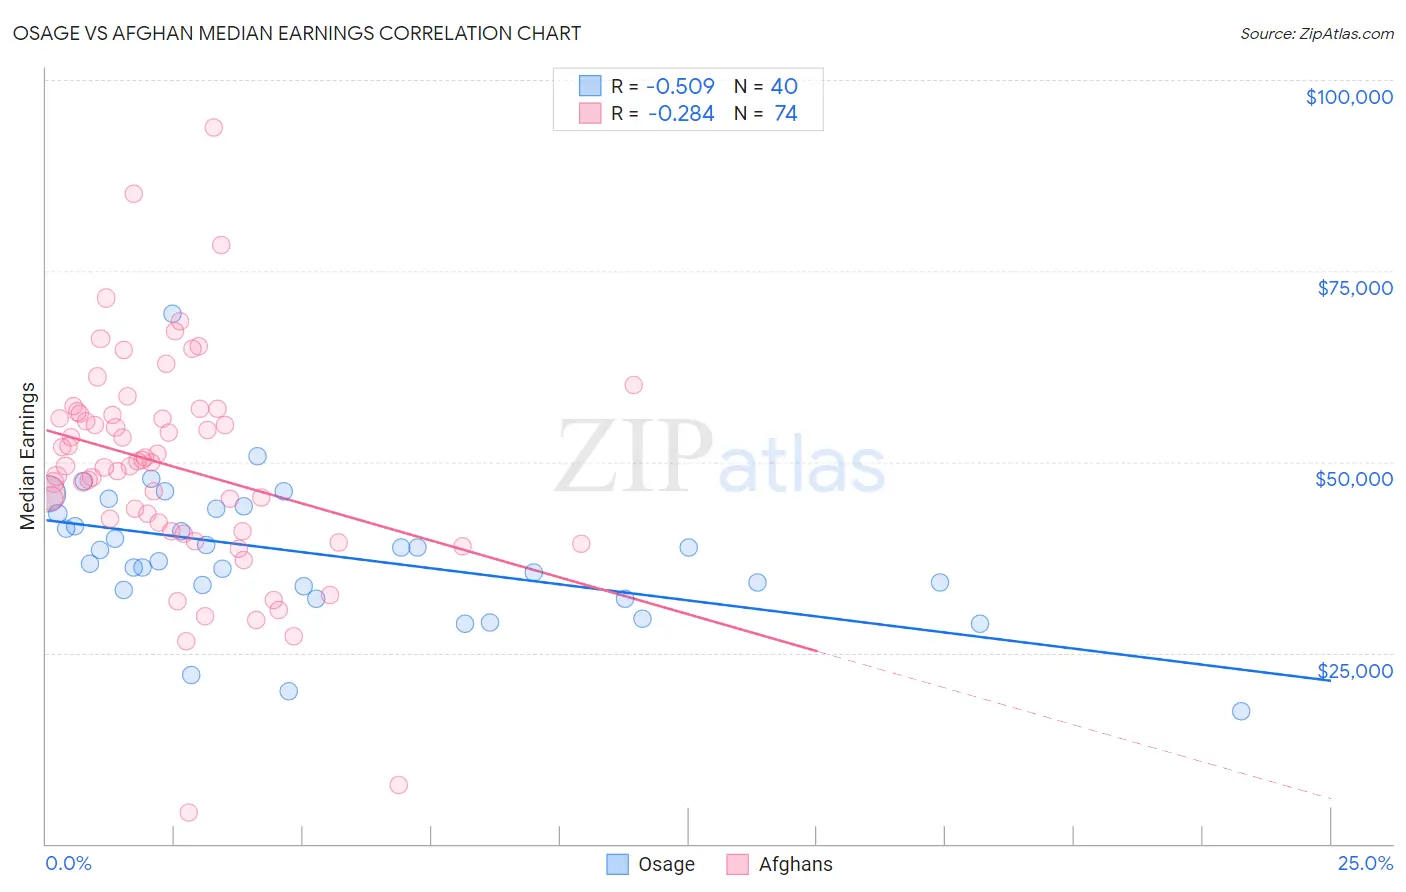
Osage vs Afghan Median Earnings Correlation Chart
The statistical analysis conducted on geographies consisting of 91,804,179 people shows a substantial negative correlation between the proportion of Osage and median earnings in the United States with a correlation coefficient (R) of -0.509 and weighted average of $42,651. Similarly, the statistical analysis conducted on geographies consisting of 148,874,377 people shows a weak negative correlation between the proportion of Afghans and median earnings in the United States with a correlation coefficient (R) of -0.284 and weighted average of $51,112, a difference of 19.8%.
Median Earnings Correlation Summary
| Measurement | Osage | Afghan |
| Minimum | $17,308 | $4,034 |
| Maximum | $69,422 | $93,750 |
| Range | $52,114 | $89,716 |
| Mean | $37,848 | $49,335 |
| Median | $37,712 | $49,670 |
| Interquartile 25% (IQ1) | $33,454 | $40,877 |
| Interquartile 75% (IQ3) | $43,538 | $56,283 |
| Interquartile Range (IQR) | $10,084 | $15,406 |
| Standard Deviation (Sample) | $9,089 | $14,513 |
| Standard Deviation (Population) | $8,975 | $14,415 |
Similar Demographics by Median Earnings
Demographics Similar to Osage by Median Earnings
In terms of median earnings, the demographic groups most similar to Osage are Pennsylvania German ($42,615, a difference of 0.090%), Belizean ($42,702, a difference of 0.12%), American ($42,742, a difference of 0.21%), Cree ($42,777, a difference of 0.29%), and Iroquois ($42,430, a difference of 0.52%).
| Demographics | Rating | Rank | Median Earnings |
| Inupiat | 0.8 /100 | #263 | Tragic $43,000 |
| Immigrants | Liberia | 0.7 /100 | #264 | Tragic $42,923 |
| Salvadorans | 0.7 /100 | #265 | Tragic $42,912 |
| Immigrants | Laos | 0.7 /100 | #266 | Tragic $42,884 |
| Cree | 0.6 /100 | #267 | Tragic $42,777 |
| Americans | 0.6 /100 | #268 | Tragic $42,742 |
| Belizeans | 0.5 /100 | #269 | Tragic $42,702 |
| Osage | 0.5 /100 | #270 | Tragic $42,651 |
| Pennsylvania Germans | 0.5 /100 | #271 | Tragic $42,615 |
| Iroquois | 0.4 /100 | #272 | Tragic $42,430 |
| Immigrants | Dominica | 0.4 /100 | #273 | Tragic $42,420 |
| Immigrants | El Salvador | 0.4 /100 | #274 | Tragic $42,413 |
| Immigrants | Belize | 0.3 /100 | #275 | Tragic $42,339 |
| Spanish Americans | 0.3 /100 | #276 | Tragic $42,316 |
| Central Americans | 0.3 /100 | #277 | Tragic $42,280 |
Demographics Similar to Afghans by Median Earnings
In terms of median earnings, the demographic groups most similar to Afghans are Immigrants from Spain ($51,092, a difference of 0.040%), Paraguayan ($51,068, a difference of 0.090%), Greek ($51,164, a difference of 0.10%), Mongolian ($51,038, a difference of 0.15%), and Lithuanian ($50,991, a difference of 0.24%).
| Demographics | Rating | Rank | Median Earnings |
| Immigrants | Croatia | 99.9 /100 | #59 | Exceptional $51,581 |
| Immigrants | Serbia | 99.9 /100 | #60 | Exceptional $51,557 |
| Immigrants | Latvia | 99.9 /100 | #61 | Exceptional $51,555 |
| Immigrants | Romania | 99.9 /100 | #62 | Exceptional $51,337 |
| Immigrants | Bulgaria | 99.9 /100 | #63 | Exceptional $51,318 |
| New Zealanders | 99.9 /100 | #64 | Exceptional $51,246 |
| Greeks | 99.9 /100 | #65 | Exceptional $51,164 |
| Afghans | 99.9 /100 | #66 | Exceptional $51,112 |
| Immigrants | Spain | 99.9 /100 | #67 | Exceptional $51,092 |
| Paraguayans | 99.9 /100 | #68 | Exceptional $51,068 |
| Mongolians | 99.8 /100 | #69 | Exceptional $51,038 |
| Lithuanians | 99.8 /100 | #70 | Exceptional $50,991 |
| Immigrants | Ukraine | 99.8 /100 | #71 | Exceptional $50,984 |
| Immigrants | Egypt | 99.8 /100 | #72 | Exceptional $50,901 |
| Immigrants | Netherlands | 99.8 /100 | #73 | Exceptional $50,818 |