Osage vs Canadian Median Earnings
COMPARE
Osage
Canadian
Median Earnings
Median Earnings Comparison
Osage
Canadians
$42,651
MEDIAN EARNINGS
0.5/ 100
METRIC RATING
270th/ 347
METRIC RANK
$47,911
MEDIAN EARNINGS
88.8/ 100
METRIC RATING
139th/ 347
METRIC RANK
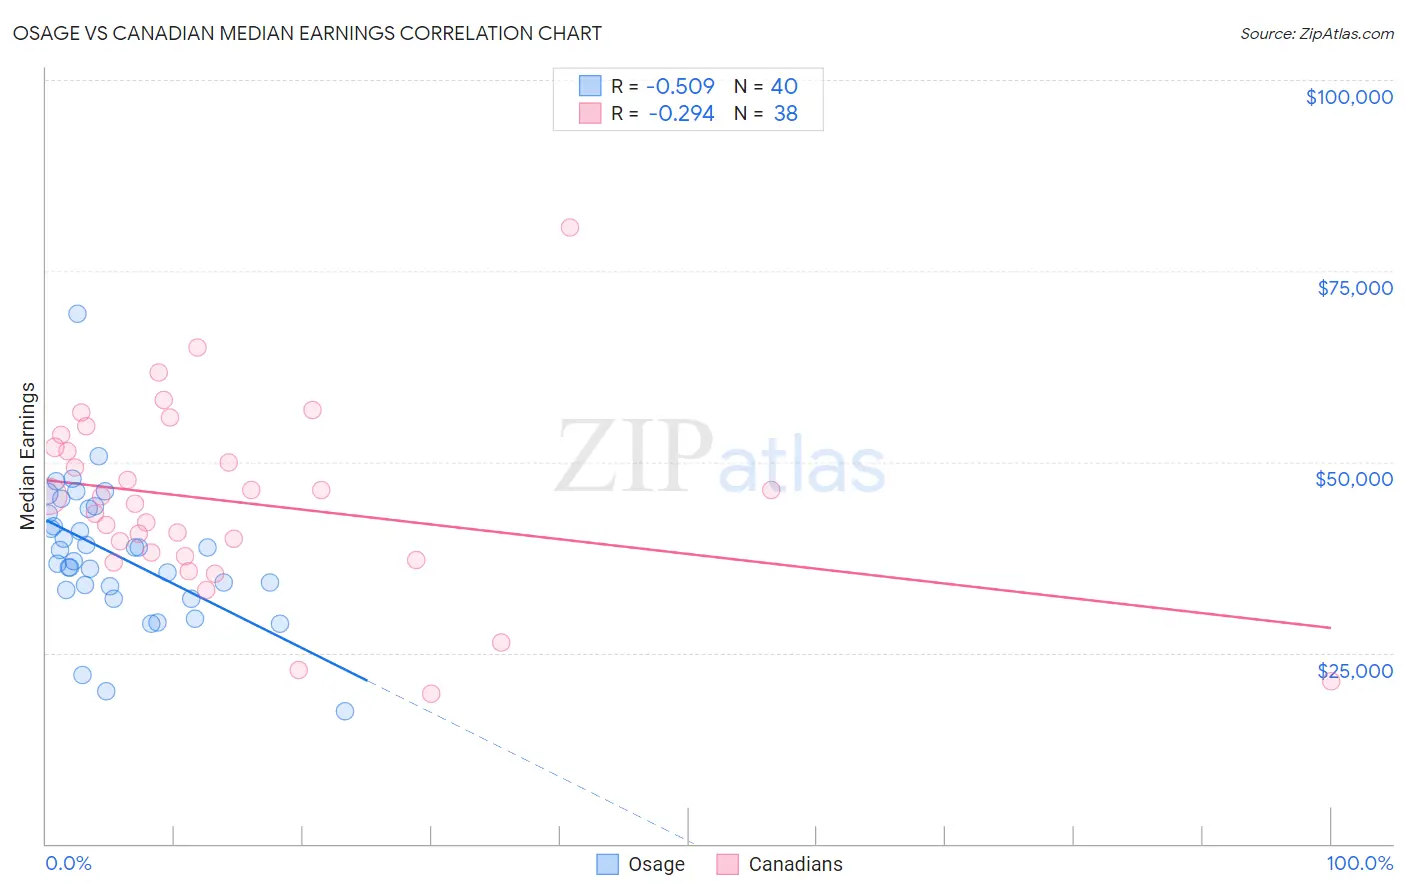
Osage vs Canadian Median Earnings Correlation Chart
The statistical analysis conducted on geographies consisting of 91,804,179 people shows a substantial negative correlation between the proportion of Osage and median earnings in the United States with a correlation coefficient (R) of -0.509 and weighted average of $42,651. Similarly, the statistical analysis conducted on geographies consisting of 437,494,547 people shows a weak negative correlation between the proportion of Canadians and median earnings in the United States with a correlation coefficient (R) of -0.294 and weighted average of $47,911, a difference of 12.3%.
Median Earnings Correlation Summary
| Measurement | Osage | Canadian |
| Minimum | $17,308 | $19,688 |
| Maximum | $69,422 | $80,682 |
| Range | $52,114 | $60,994 |
| Mean | $37,848 | $44,712 |
| Median | $37,712 | $44,948 |
| Interquartile 25% (IQ1) | $33,454 | $37,642 |
| Interquartile 75% (IQ3) | $43,538 | $51,935 |
| Interquartile Range (IQR) | $10,084 | $14,293 |
| Standard Deviation (Sample) | $9,089 | $12,220 |
| Standard Deviation (Population) | $8,975 | $12,058 |
Similar Demographics by Median Earnings
Demographics Similar to Osage by Median Earnings
In terms of median earnings, the demographic groups most similar to Osage are Pennsylvania German ($42,615, a difference of 0.090%), Belizean ($42,702, a difference of 0.12%), American ($42,742, a difference of 0.21%), Cree ($42,777, a difference of 0.29%), and Iroquois ($42,430, a difference of 0.52%).
| Demographics | Rating | Rank | Median Earnings |
| Inupiat | 0.8 /100 | #263 | Tragic $43,000 |
| Immigrants | Liberia | 0.7 /100 | #264 | Tragic $42,923 |
| Salvadorans | 0.7 /100 | #265 | Tragic $42,912 |
| Immigrants | Laos | 0.7 /100 | #266 | Tragic $42,884 |
| Cree | 0.6 /100 | #267 | Tragic $42,777 |
| Americans | 0.6 /100 | #268 | Tragic $42,742 |
| Belizeans | 0.5 /100 | #269 | Tragic $42,702 |
| Osage | 0.5 /100 | #270 | Tragic $42,651 |
| Pennsylvania Germans | 0.5 /100 | #271 | Tragic $42,615 |
| Iroquois | 0.4 /100 | #272 | Tragic $42,430 |
| Immigrants | Dominica | 0.4 /100 | #273 | Tragic $42,420 |
| Immigrants | El Salvador | 0.4 /100 | #274 | Tragic $42,413 |
| Immigrants | Belize | 0.3 /100 | #275 | Tragic $42,339 |
| Spanish Americans | 0.3 /100 | #276 | Tragic $42,316 |
| Central Americans | 0.3 /100 | #277 | Tragic $42,280 |
Demographics Similar to Canadians by Median Earnings
In terms of median earnings, the demographic groups most similar to Canadians are European ($47,915, a difference of 0.010%), Taiwanese ($47,902, a difference of 0.020%), Immigrants from Nepal ($47,925, a difference of 0.030%), Immigrants from Sierra Leone ($47,875, a difference of 0.080%), and Ugandan ($47,854, a difference of 0.12%).
| Demographics | Rating | Rank | Median Earnings |
| British | 92.2 /100 | #132 | Exceptional $48,189 |
| Immigrants | Uganda | 90.5 /100 | #133 | Exceptional $48,041 |
| Sri Lankans | 90.5 /100 | #134 | Exceptional $48,040 |
| Portuguese | 90.4 /100 | #135 | Exceptional $48,032 |
| Slovenes | 90.0 /100 | #136 | Excellent $47,995 |
| Immigrants | Nepal | 89.0 /100 | #137 | Excellent $47,925 |
| Europeans | 88.9 /100 | #138 | Excellent $47,915 |
| Canadians | 88.8 /100 | #139 | Excellent $47,911 |
| Taiwanese | 88.7 /100 | #140 | Excellent $47,902 |
| Immigrants | Sierra Leone | 88.3 /100 | #141 | Excellent $47,875 |
| Ugandans | 88.0 /100 | #142 | Excellent $47,854 |
| Swedes | 88.0 /100 | #143 | Excellent $47,851 |
| Hungarians | 87.1 /100 | #144 | Excellent $47,795 |
| Immigrants | Saudi Arabia | 85.6 /100 | #145 | Excellent $47,704 |
| Immigrants | Chile | 85.5 /100 | #146 | Excellent $47,697 |