Osage vs Scotch-Irish Median Earnings
COMPARE
Osage
Scotch-Irish
Median Earnings
Median Earnings Comparison
Osage
Scotch-Irish
$42,651
MEDIAN EARNINGS
0.5/ 100
METRIC RATING
270th/ 347
METRIC RANK
$44,924
MEDIAN EARNINGS
10.7/ 100
METRIC RATING
229th/ 347
METRIC RANK
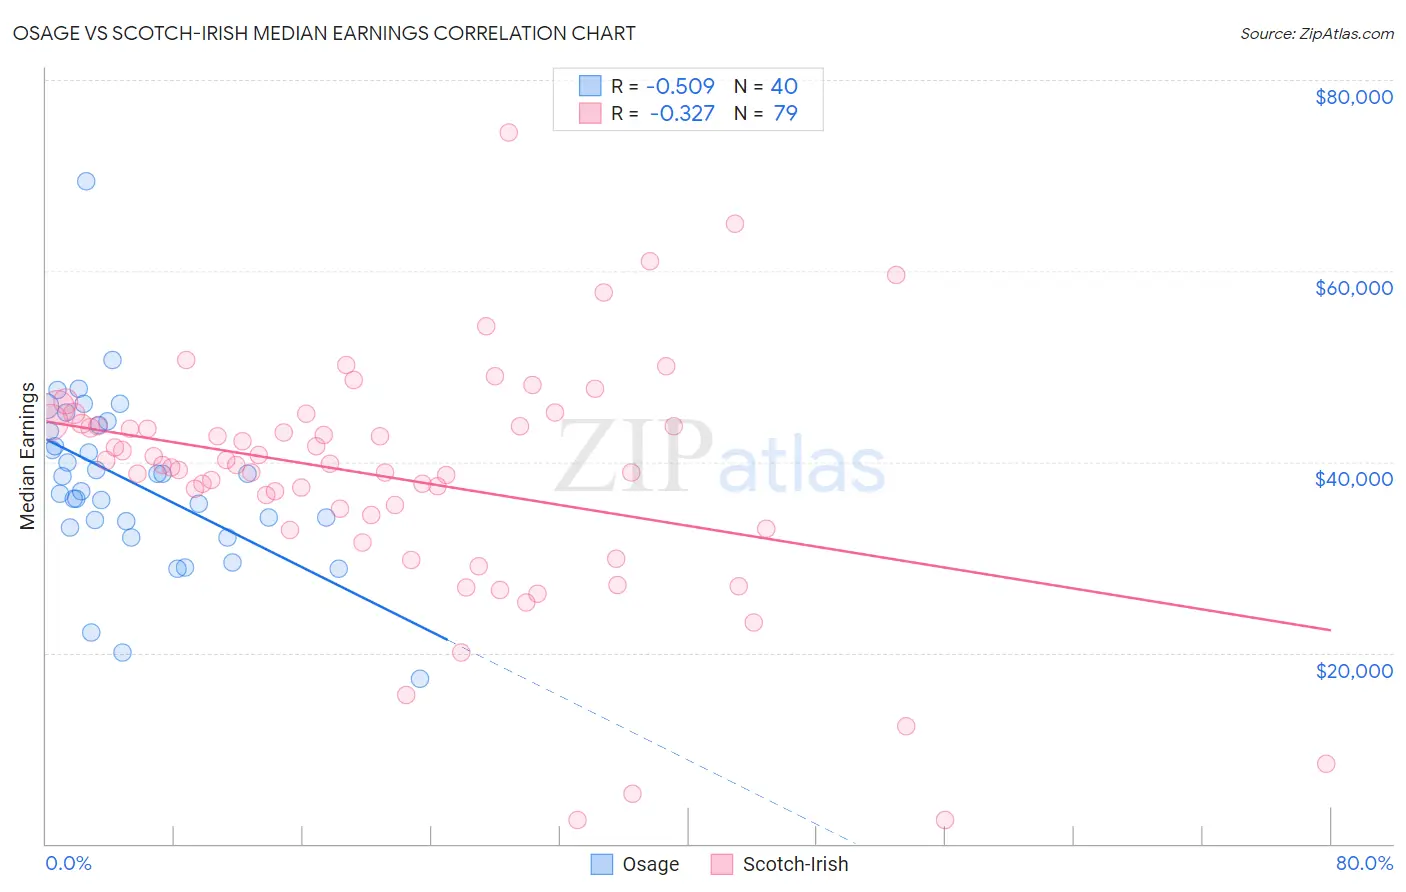
Osage vs Scotch-Irish Median Earnings Correlation Chart
The statistical analysis conducted on geographies consisting of 91,804,179 people shows a substantial negative correlation between the proportion of Osage and median earnings in the United States with a correlation coefficient (R) of -0.509 and weighted average of $42,651. Similarly, the statistical analysis conducted on geographies consisting of 548,498,961 people shows a mild negative correlation between the proportion of Scotch-Irish and median earnings in the United States with a correlation coefficient (R) of -0.327 and weighted average of $44,924, a difference of 5.3%.
Median Earnings Correlation Summary
| Measurement | Osage | Scotch-Irish |
| Minimum | $17,308 | $2,499 |
| Maximum | $69,422 | $74,508 |
| Range | $52,114 | $72,009 |
| Mean | $37,848 | $38,268 |
| Median | $37,712 | $39,708 |
| Interquartile 25% (IQ1) | $33,454 | $32,986 |
| Interquartile 75% (IQ3) | $43,538 | $43,991 |
| Interquartile Range (IQR) | $10,084 | $11,005 |
| Standard Deviation (Sample) | $9,089 | $12,720 |
| Standard Deviation (Population) | $8,975 | $12,639 |
Similar Demographics by Median Earnings
Demographics Similar to Osage by Median Earnings
In terms of median earnings, the demographic groups most similar to Osage are Pennsylvania German ($42,615, a difference of 0.090%), Belizean ($42,702, a difference of 0.12%), American ($42,742, a difference of 0.21%), Cree ($42,777, a difference of 0.29%), and Iroquois ($42,430, a difference of 0.52%).
| Demographics | Rating | Rank | Median Earnings |
| Inupiat | 0.8 /100 | #263 | Tragic $43,000 |
| Immigrants | Liberia | 0.7 /100 | #264 | Tragic $42,923 |
| Salvadorans | 0.7 /100 | #265 | Tragic $42,912 |
| Immigrants | Laos | 0.7 /100 | #266 | Tragic $42,884 |
| Cree | 0.6 /100 | #267 | Tragic $42,777 |
| Americans | 0.6 /100 | #268 | Tragic $42,742 |
| Belizeans | 0.5 /100 | #269 | Tragic $42,702 |
| Osage | 0.5 /100 | #270 | Tragic $42,651 |
| Pennsylvania Germans | 0.5 /100 | #271 | Tragic $42,615 |
| Iroquois | 0.4 /100 | #272 | Tragic $42,430 |
| Immigrants | Dominica | 0.4 /100 | #273 | Tragic $42,420 |
| Immigrants | El Salvador | 0.4 /100 | #274 | Tragic $42,413 |
| Immigrants | Belize | 0.3 /100 | #275 | Tragic $42,339 |
| Spanish Americans | 0.3 /100 | #276 | Tragic $42,316 |
| Central Americans | 0.3 /100 | #277 | Tragic $42,280 |
Demographics Similar to Scotch-Irish by Median Earnings
In terms of median earnings, the demographic groups most similar to Scotch-Irish are Immigrants from Western Africa ($44,893, a difference of 0.070%), Immigrants from Iraq ($44,988, a difference of 0.14%), Japanese ($44,825, a difference of 0.22%), Native Hawaiian ($45,027, a difference of 0.23%), and Immigrants from Nigeria ($45,030, a difference of 0.24%).
| Demographics | Rating | Rank | Median Earnings |
| Immigrants | Panama | 15.0 /100 | #222 | Poor $45,198 |
| Whites/Caucasians | 15.0 /100 | #223 | Poor $45,197 |
| West Indians | 13.9 /100 | #224 | Poor $45,132 |
| Immigrants | Cambodia | 13.2 /100 | #225 | Poor $45,090 |
| Immigrants | Nigeria | 12.2 /100 | #226 | Poor $45,030 |
| Native Hawaiians | 12.2 /100 | #227 | Poor $45,027 |
| Immigrants | Iraq | 11.6 /100 | #228 | Poor $44,988 |
| Scotch-Irish | 10.7 /100 | #229 | Poor $44,924 |
| Immigrants | Western Africa | 10.3 /100 | #230 | Poor $44,893 |
| Japanese | 9.5 /100 | #231 | Tragic $44,825 |
| Delaware | 9.0 /100 | #232 | Tragic $44,783 |
| Immigrants | Sudan | 8.8 /100 | #233 | Tragic $44,767 |
| Cape Verdeans | 7.5 /100 | #234 | Tragic $44,640 |
| Venezuelans | 6.9 /100 | #235 | Tragic $44,580 |
| British West Indians | 6.7 /100 | #236 | Tragic $44,552 |