Nonimmigrants vs Yup'ik Median Household Income
COMPARE
Nonimmigrants
Yup'ik
Median Household Income
Median Household Income Comparison
Nonimmigrants
Yup'ik
$79,429
MEDIAN HOUSEHOLD INCOME
2.6/ 100
METRIC RATING
241st/ 347
METRIC RANK
$69,695
MEDIAN HOUSEHOLD INCOME
0.0/ 100
METRIC RATING
324th/ 347
METRIC RANK
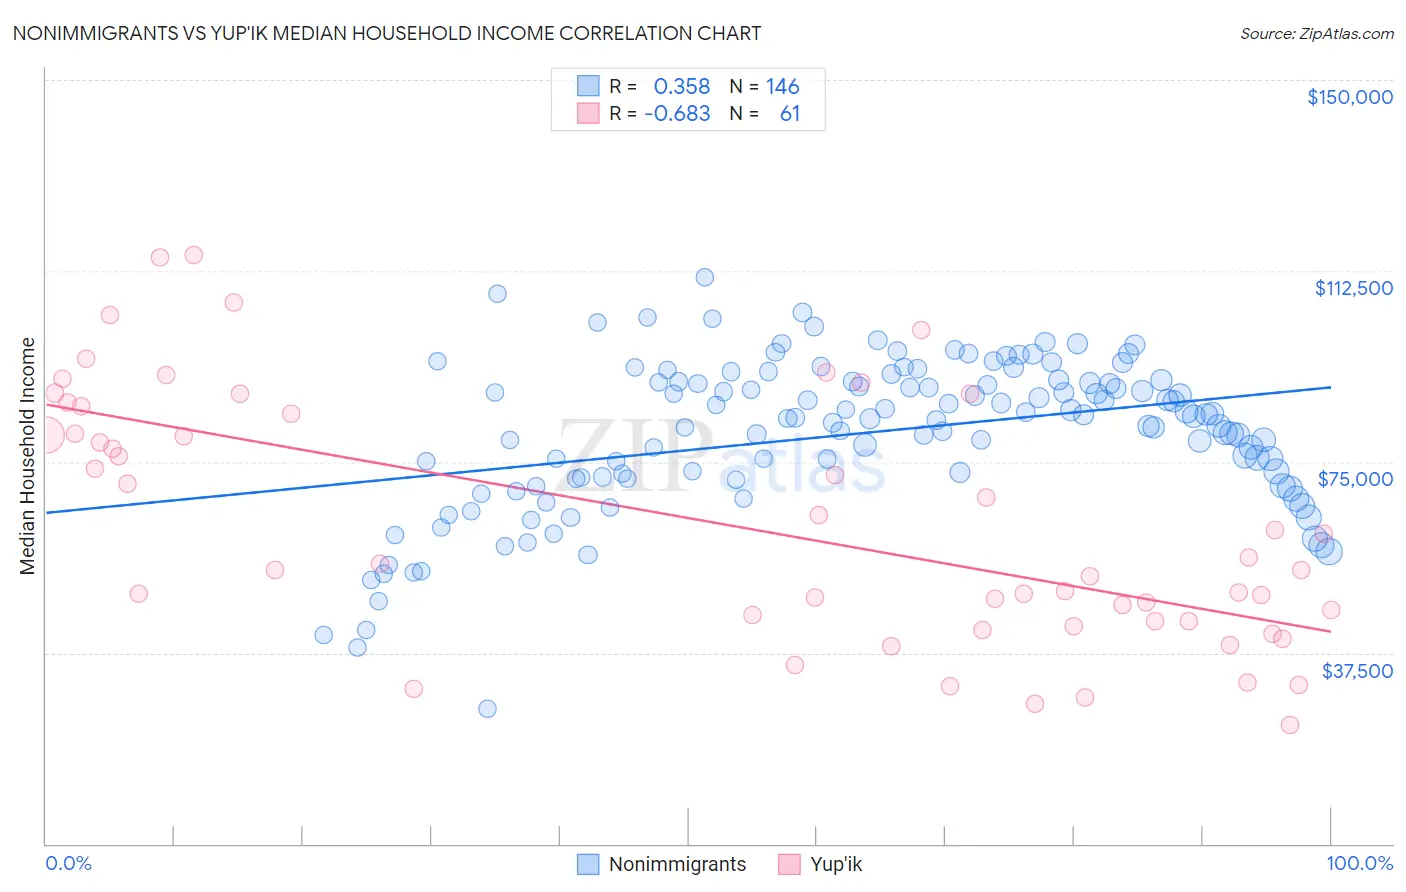
Nonimmigrants vs Yup'ik Median Household Income Correlation Chart
The statistical analysis conducted on geographies consisting of 582,891,477 people shows a mild positive correlation between the proportion of Nonimmigrants and median household income in the United States with a correlation coefficient (R) of 0.358 and weighted average of $79,429. Similarly, the statistical analysis conducted on geographies consisting of 39,952,449 people shows a significant negative correlation between the proportion of Yup'ik and median household income in the United States with a correlation coefficient (R) of -0.683 and weighted average of $69,695, a difference of 14.0%.
Median Household Income Correlation Summary
| Measurement | Nonimmigrants | Yup'ik |
| Minimum | $26,558 | $23,333 |
| Maximum | $111,218 | $115,625 |
| Range | $84,660 | $92,292 |
| Mean | $80,540 | $62,948 |
| Median | $83,608 | $55,000 |
| Interquartile 25% (IQ1) | $71,762 | $43,673 |
| Interquartile 75% (IQ3) | $90,776 | $85,198 |
| Interquartile Range (IQR) | $19,014 | $41,525 |
| Standard Deviation (Sample) | $15,013 | $24,365 |
| Standard Deviation (Population) | $14,961 | $24,165 |
Similar Demographics by Median Household Income
Demographics Similar to Nonimmigrants by Median Household Income
In terms of median household income, the demographic groups most similar to Nonimmigrants are Immigrants from Western Africa ($79,490, a difference of 0.080%), Alaska Native ($79,509, a difference of 0.10%), Barbadian ($79,664, a difference of 0.30%), Nicaraguan ($79,737, a difference of 0.39%), and Immigrants from Sudan ($79,103, a difference of 0.41%).
| Demographics | Rating | Rank | Median Household Income |
| Immigrants | Ecuador | 4.5 /100 | #234 | Tragic $80,341 |
| Immigrants | Guyana | 4.5 /100 | #235 | Tragic $80,324 |
| Immigrants | Bosnia and Herzegovina | 3.4 /100 | #236 | Tragic $79,888 |
| Nicaraguans | 3.1 /100 | #237 | Tragic $79,737 |
| Barbadians | 3.0 /100 | #238 | Tragic $79,664 |
| Alaska Natives | 2.7 /100 | #239 | Tragic $79,509 |
| Immigrants | Western Africa | 2.7 /100 | #240 | Tragic $79,490 |
| Immigrants | Nonimmigrants | 2.6 /100 | #241 | Tragic $79,429 |
| Immigrants | Sudan | 2.1 /100 | #242 | Tragic $79,103 |
| Immigrants | Barbados | 1.9 /100 | #243 | Tragic $78,989 |
| Marshallese | 1.9 /100 | #244 | Tragic $78,930 |
| Inupiat | 1.8 /100 | #245 | Tragic $78,841 |
| Central Americans | 1.7 /100 | #246 | Tragic $78,803 |
| Immigrants | Burma/Myanmar | 1.6 /100 | #247 | Tragic $78,682 |
| Sudanese | 1.5 /100 | #248 | Tragic $78,529 |
Demographics Similar to Yup'ik by Median Household Income
In terms of median household income, the demographic groups most similar to Yup'ik are Bahamian ($69,726, a difference of 0.040%), Choctaw ($69,947, a difference of 0.36%), Seminole ($69,420, a difference of 0.40%), Chickasaw ($70,005, a difference of 0.45%), and Colville ($70,094, a difference of 0.57%).
| Demographics | Rating | Rank | Median Household Income |
| Cajuns | 0.0 /100 | #317 | Tragic $70,605 |
| Chippewa | 0.0 /100 | #318 | Tragic $70,539 |
| Immigrants | Dominican Republic | 0.0 /100 | #319 | Tragic $70,208 |
| Colville | 0.0 /100 | #320 | Tragic $70,094 |
| Chickasaw | 0.0 /100 | #321 | Tragic $70,005 |
| Choctaw | 0.0 /100 | #322 | Tragic $69,947 |
| Bahamians | 0.0 /100 | #323 | Tragic $69,726 |
| Yup'ik | 0.0 /100 | #324 | Tragic $69,695 |
| Seminole | 0.0 /100 | #325 | Tragic $69,420 |
| Yuman | 0.0 /100 | #326 | Tragic $68,743 |
| Immigrants | Cuba | 0.0 /100 | #327 | Tragic $68,461 |
| Menominee | 0.0 /100 | #328 | Tragic $68,423 |
| Dutch West Indians | 0.0 /100 | #329 | Tragic $68,412 |
| Arapaho | 0.0 /100 | #330 | Tragic $67,965 |
| Natives/Alaskans | 0.0 /100 | #331 | Tragic $67,879 |