Immigrants from Haiti vs Yup'ik Median Household Income
COMPARE
Immigrants from Haiti
Yup'ik
Median Household Income
Median Household Income Comparison
Immigrants from Haiti
Yup'ik
$72,599
MEDIAN HOUSEHOLD INCOME
0.0/ 100
METRIC RATING
304th/ 347
METRIC RANK
$69,695
MEDIAN HOUSEHOLD INCOME
0.0/ 100
METRIC RATING
324th/ 347
METRIC RANK
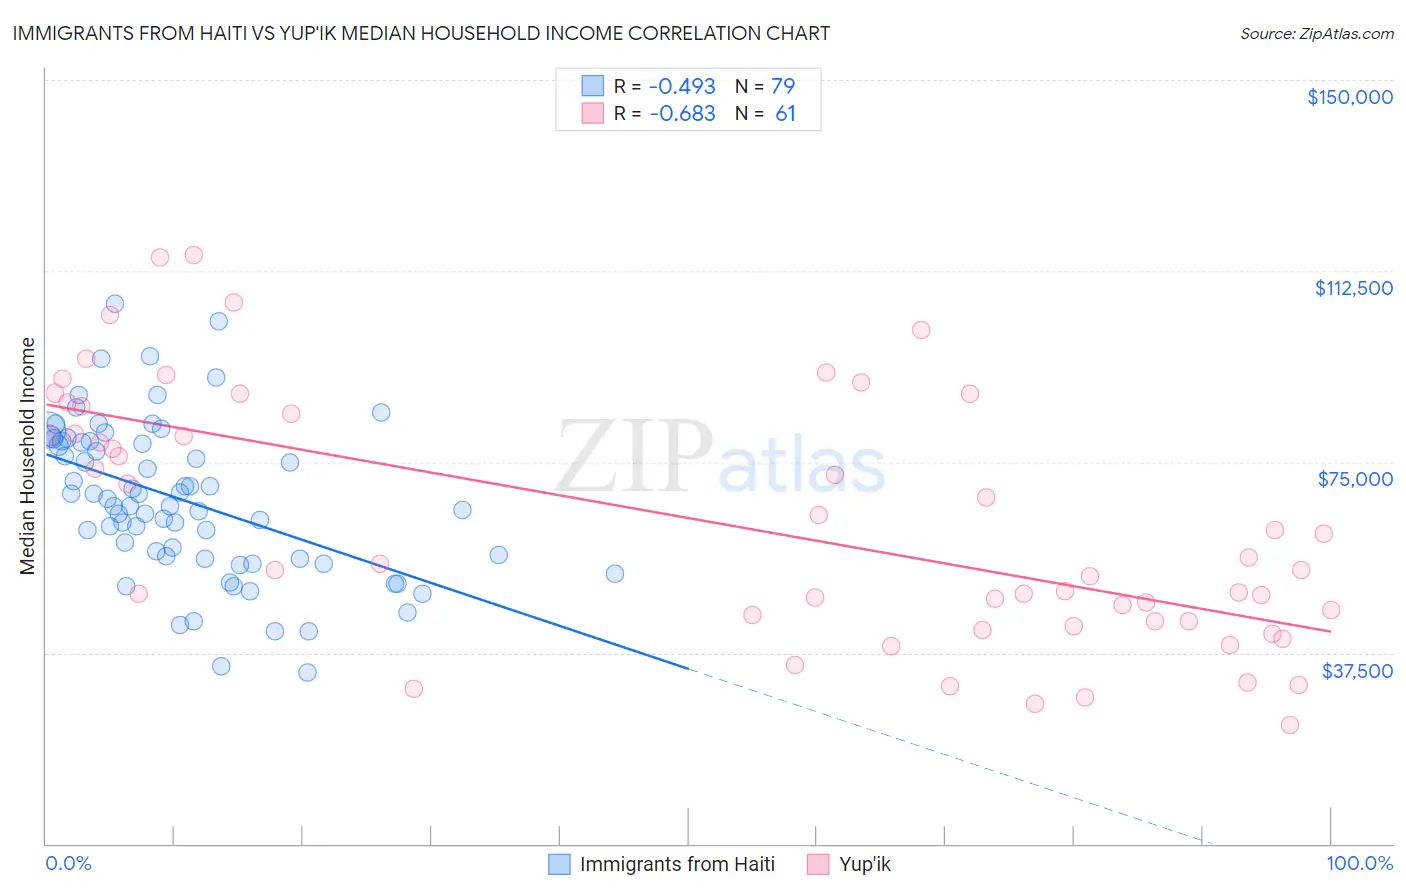
Immigrants from Haiti vs Yup'ik Median Household Income Correlation Chart
The statistical analysis conducted on geographies consisting of 225,133,235 people shows a moderate negative correlation between the proportion of Immigrants from Haiti and median household income in the United States with a correlation coefficient (R) of -0.493 and weighted average of $72,599. Similarly, the statistical analysis conducted on geographies consisting of 39,952,449 people shows a significant negative correlation between the proportion of Yup'ik and median household income in the United States with a correlation coefficient (R) of -0.683 and weighted average of $69,695, a difference of 4.2%.
Median Household Income Correlation Summary
| Measurement | Immigrants from Haiti | Yup'ik |
| Minimum | $33,629 | $23,333 |
| Maximum | $105,986 | $115,625 |
| Range | $72,357 | $92,292 |
| Mean | $67,399 | $62,948 |
| Median | $66,369 | $55,000 |
| Interquartile 25% (IQ1) | $56,044 | $43,673 |
| Interquartile 75% (IQ3) | $78,973 | $85,198 |
| Interquartile Range (IQR) | $22,929 | $41,525 |
| Standard Deviation (Sample) | $15,193 | $24,365 |
| Standard Deviation (Population) | $15,096 | $24,165 |
Demographics Similar to Immigrants from Haiti and Yup'ik by Median Household Income
In terms of median household income, the demographic groups most similar to Immigrants from Haiti are Honduran ($72,588, a difference of 0.020%), Potawatomi ($72,576, a difference of 0.030%), Ute ($72,402, a difference of 0.27%), Yakama ($72,225, a difference of 0.52%), and Immigrants from Caribbean ($71,860, a difference of 1.0%). Similarly, the demographic groups most similar to Yup'ik are Bahamian ($69,726, a difference of 0.040%), Choctaw ($69,947, a difference of 0.36%), Chickasaw ($70,005, a difference of 0.45%), Colville ($70,094, a difference of 0.57%), and Immigrants from Dominican Republic ($70,208, a difference of 0.74%).
| Demographics | Rating | Rank | Median Household Income |
| Immigrants | Haiti | 0.0 /100 | #304 | Tragic $72,599 |
| Hondurans | 0.0 /100 | #305 | Tragic $72,588 |
| Potawatomi | 0.0 /100 | #306 | Tragic $72,576 |
| Ute | 0.0 /100 | #307 | Tragic $72,402 |
| Yakama | 0.0 /100 | #308 | Tragic $72,225 |
| Immigrants | Caribbean | 0.0 /100 | #309 | Tragic $71,860 |
| U.S. Virgin Islanders | 0.0 /100 | #310 | Tragic $71,853 |
| Immigrants | Zaire | 0.0 /100 | #311 | Tragic $71,801 |
| Immigrants | Honduras | 0.0 /100 | #312 | Tragic $71,452 |
| Immigrants | Bahamas | 0.0 /100 | #313 | Tragic $71,349 |
| Dominicans | 0.0 /100 | #314 | Tragic $71,302 |
| Ottawa | 0.0 /100 | #315 | Tragic $70,984 |
| Apache | 0.0 /100 | #316 | Tragic $70,927 |
| Cajuns | 0.0 /100 | #317 | Tragic $70,605 |
| Chippewa | 0.0 /100 | #318 | Tragic $70,539 |
| Immigrants | Dominican Republic | 0.0 /100 | #319 | Tragic $70,208 |
| Colville | 0.0 /100 | #320 | Tragic $70,094 |
| Chickasaw | 0.0 /100 | #321 | Tragic $70,005 |
| Choctaw | 0.0 /100 | #322 | Tragic $69,947 |
| Bahamians | 0.0 /100 | #323 | Tragic $69,726 |
| Yup'ik | 0.0 /100 | #324 | Tragic $69,695 |