Immigrants from North America vs Yup'ik Median Household Income
COMPARE
Immigrants from North America
Yup'ik
Median Household Income
Median Household Income Comparison
Immigrants from North America
Yup'ik
$91,860
MEDIAN HOUSEHOLD INCOME
98.7/ 100
METRIC RATING
94th/ 347
METRIC RANK
$69,695
MEDIAN HOUSEHOLD INCOME
0.0/ 100
METRIC RATING
324th/ 347
METRIC RANK
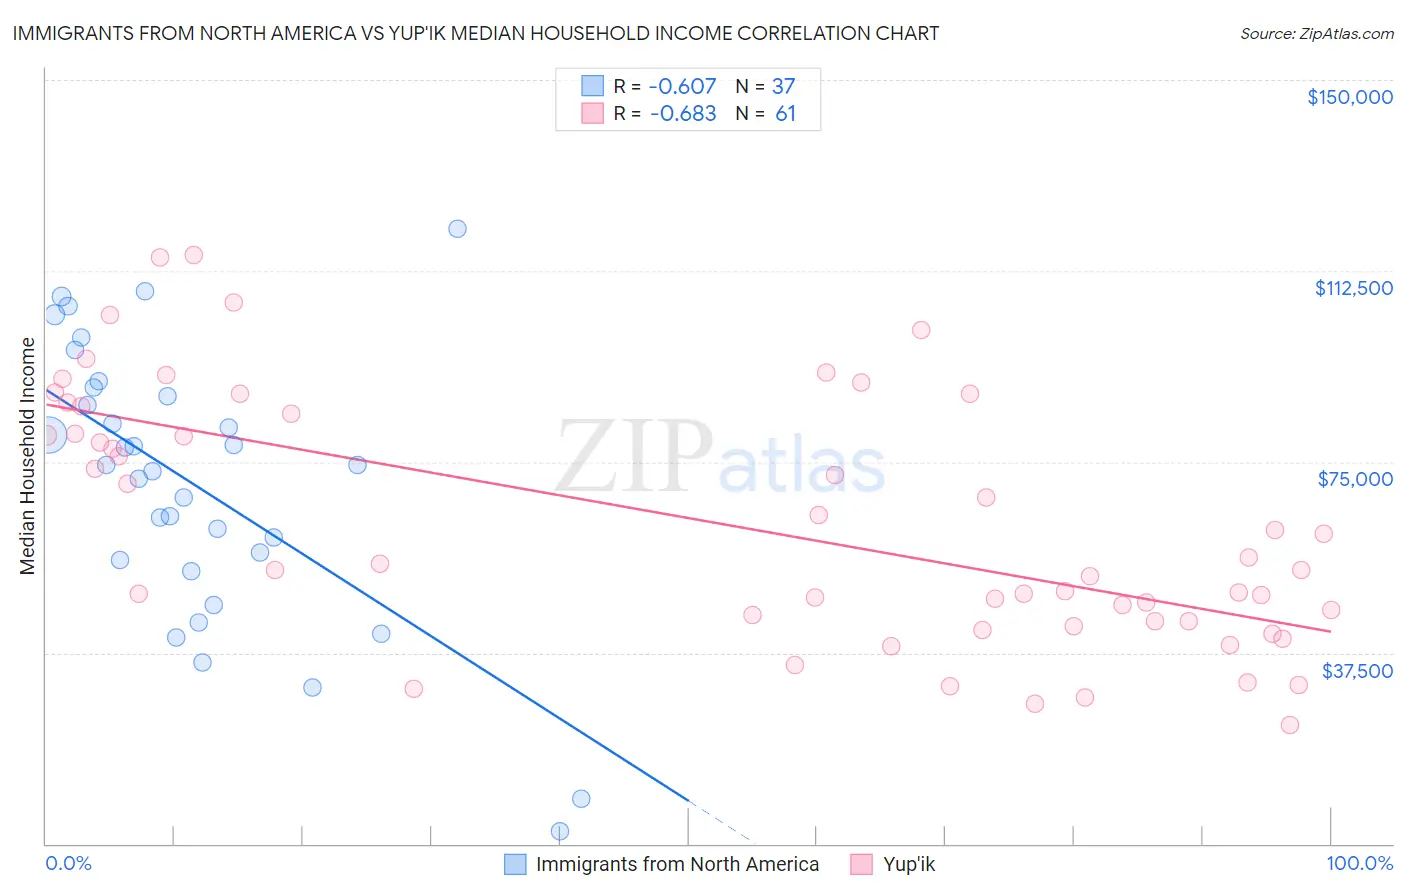
Immigrants from North America vs Yup'ik Median Household Income Correlation Chart
The statistical analysis conducted on geographies consisting of 462,084,352 people shows a significant negative correlation between the proportion of Immigrants from North America and median household income in the United States with a correlation coefficient (R) of -0.607 and weighted average of $91,860. Similarly, the statistical analysis conducted on geographies consisting of 39,952,449 people shows a significant negative correlation between the proportion of Yup'ik and median household income in the United States with a correlation coefficient (R) of -0.683 and weighted average of $69,695, a difference of 31.8%.
Median Household Income Correlation Summary
| Measurement | Immigrants from North America | Yup'ik |
| Minimum | $2,499 | $23,333 |
| Maximum | $120,804 | $115,625 |
| Range | $118,305 | $92,292 |
| Mean | $70,374 | $62,948 |
| Median | $74,312 | $55,000 |
| Interquartile 25% (IQ1) | $54,648 | $43,673 |
| Interquartile 75% (IQ3) | $88,741 | $85,198 |
| Interquartile Range (IQR) | $34,094 | $41,525 |
| Standard Deviation (Sample) | $27,060 | $24,365 |
| Standard Deviation (Population) | $26,692 | $24,165 |
Similar Demographics by Median Household Income
Demographics Similar to Immigrants from North America by Median Household Income
In terms of median household income, the demographic groups most similar to Immigrants from North America are Immigrants from Lebanon ($91,887, a difference of 0.030%), Armenian ($91,807, a difference of 0.060%), Jordanian ($91,794, a difference of 0.070%), Immigrants from Western Europe ($91,936, a difference of 0.080%), and Assyrian/Chaldean/Syriac ($91,991, a difference of 0.14%).
| Demographics | Rating | Rank | Median Household Income |
| Immigrants | Hungary | 98.9 /100 | #87 | Exceptional $92,094 |
| Immigrants | Canada | 98.8 /100 | #88 | Exceptional $92,029 |
| Romanians | 98.8 /100 | #89 | Exceptional $91,994 |
| Assyrians/Chaldeans/Syriacs | 98.8 /100 | #90 | Exceptional $91,991 |
| Immigrants | Vietnam | 98.8 /100 | #91 | Exceptional $91,987 |
| Immigrants | Western Europe | 98.8 /100 | #92 | Exceptional $91,936 |
| Immigrants | Lebanon | 98.7 /100 | #93 | Exceptional $91,887 |
| Immigrants | North America | 98.7 /100 | #94 | Exceptional $91,860 |
| Armenians | 98.7 /100 | #95 | Exceptional $91,807 |
| Jordanians | 98.7 /100 | #96 | Exceptional $91,794 |
| Immigrants | Serbia | 98.6 /100 | #97 | Exceptional $91,730 |
| Immigrants | Southern Europe | 98.5 /100 | #98 | Exceptional $91,605 |
| Immigrants | South Eastern Asia | 98.4 /100 | #99 | Exceptional $91,541 |
| Ukrainians | 98.3 /100 | #100 | Exceptional $91,456 |
| Immigrants | Moldova | 98.3 /100 | #101 | Exceptional $91,446 |
Demographics Similar to Yup'ik by Median Household Income
In terms of median household income, the demographic groups most similar to Yup'ik are Bahamian ($69,726, a difference of 0.040%), Choctaw ($69,947, a difference of 0.36%), Seminole ($69,420, a difference of 0.40%), Chickasaw ($70,005, a difference of 0.45%), and Colville ($70,094, a difference of 0.57%).
| Demographics | Rating | Rank | Median Household Income |
| Cajuns | 0.0 /100 | #317 | Tragic $70,605 |
| Chippewa | 0.0 /100 | #318 | Tragic $70,539 |
| Immigrants | Dominican Republic | 0.0 /100 | #319 | Tragic $70,208 |
| Colville | 0.0 /100 | #320 | Tragic $70,094 |
| Chickasaw | 0.0 /100 | #321 | Tragic $70,005 |
| Choctaw | 0.0 /100 | #322 | Tragic $69,947 |
| Bahamians | 0.0 /100 | #323 | Tragic $69,726 |
| Yup'ik | 0.0 /100 | #324 | Tragic $69,695 |
| Seminole | 0.0 /100 | #325 | Tragic $69,420 |
| Yuman | 0.0 /100 | #326 | Tragic $68,743 |
| Immigrants | Cuba | 0.0 /100 | #327 | Tragic $68,461 |
| Menominee | 0.0 /100 | #328 | Tragic $68,423 |
| Dutch West Indians | 0.0 /100 | #329 | Tragic $68,412 |
| Arapaho | 0.0 /100 | #330 | Tragic $67,965 |
| Natives/Alaskans | 0.0 /100 | #331 | Tragic $67,879 |