Nonimmigrants vs Yup'ik In Labor Force | Age 25-29
COMPARE
Nonimmigrants
Yup'ik
In Labor Force | Age 25-29
In Labor Force | Age 25-29 Comparison
Nonimmigrants
Yup'ik
83.7%
IN LABOR FORCE | AGE 25-29
0.3/ 100
METRIC RATING
248th/ 347
METRIC RANK
73.1%
IN LABOR FORCE | AGE 25-29
0.0/ 100
METRIC RATING
347th/ 347
METRIC RANK
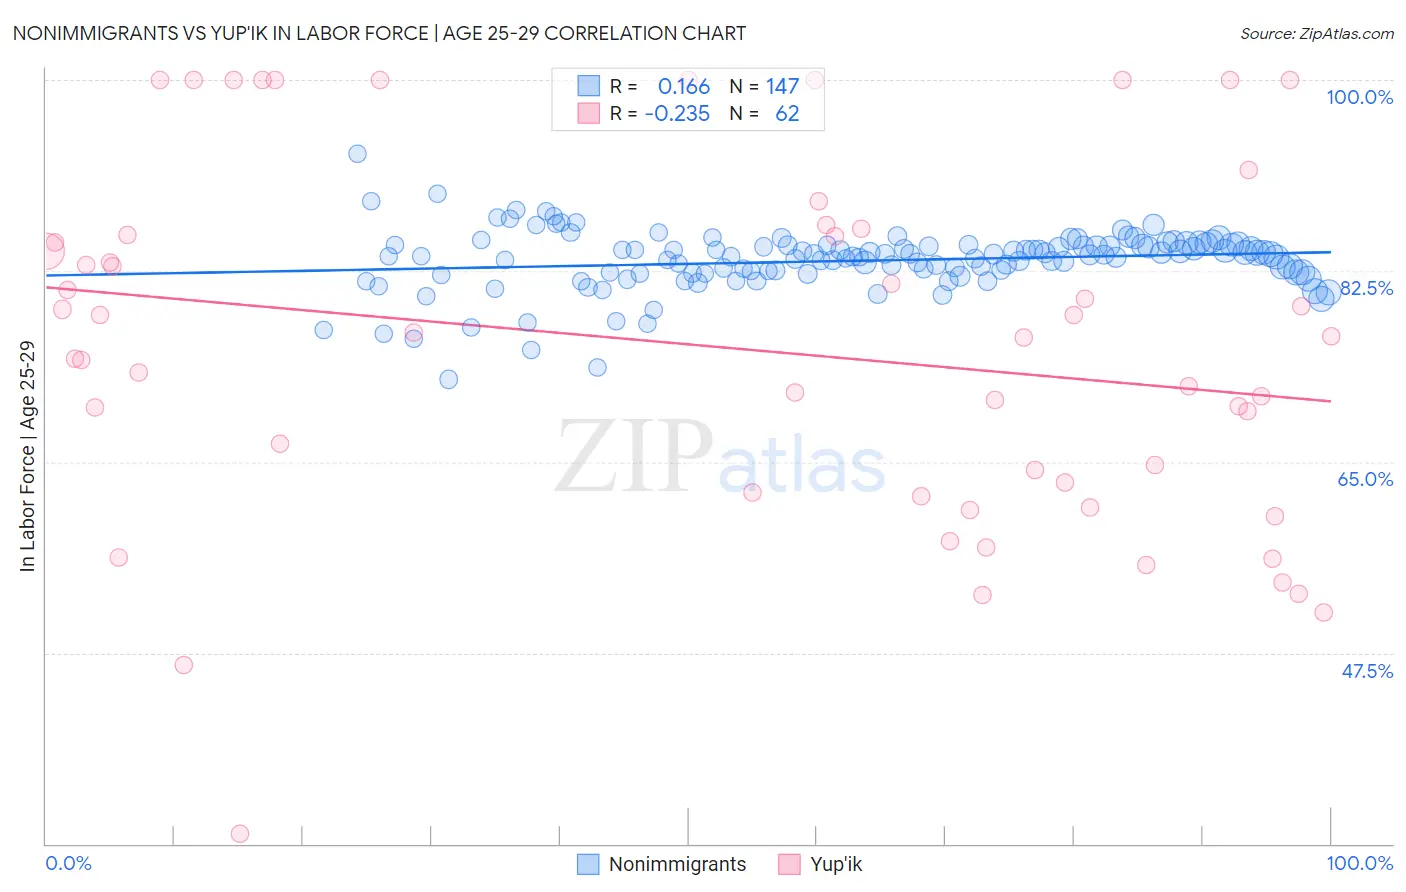
Nonimmigrants vs Yup'ik In Labor Force | Age 25-29 Correlation Chart
The statistical analysis conducted on geographies consisting of 582,659,660 people shows a poor positive correlation between the proportion of Nonimmigrants and labor force participation rate among population between the ages 25 and 29 in the United States with a correlation coefficient (R) of 0.166 and weighted average of 83.7%. Similarly, the statistical analysis conducted on geographies consisting of 39,957,575 people shows a weak negative correlation between the proportion of Yup'ik and labor force participation rate among population between the ages 25 and 29 in the United States with a correlation coefficient (R) of -0.235 and weighted average of 73.1%, a difference of 14.6%.
In Labor Force | Age 25-29 Correlation Summary
| Measurement | Nonimmigrants | Yup'ik |
| Minimum | 72.6% | 30.9% |
| Maximum | 93.2% | 100.0% |
| Range | 20.6% | 69.1% |
| Mean | 83.4% | 75.5% |
| Median | 83.9% | 76.4% |
| Interquartile 25% (IQ1) | 82.3% | 62.2% |
| Interquartile 75% (IQ3) | 84.8% | 85.8% |
| Interquartile Range (IQR) | 2.5% | 23.6% |
| Standard Deviation (Sample) | 2.8% | 16.4% |
| Standard Deviation (Population) | 2.8% | 16.3% |
Similar Demographics by In Labor Force | Age 25-29
Demographics Similar to Nonimmigrants by In Labor Force | Age 25-29
In terms of in labor force | age 25-29, the demographic groups most similar to Nonimmigrants are Hmong (83.7%, a difference of 0.010%), Immigrants from El Salvador (83.7%, a difference of 0.020%), Cree (83.8%, a difference of 0.030%), Central American (83.7%, a difference of 0.030%), and Bahamian (83.7%, a difference of 0.040%).
| Demographics | Rating | Rank | In Labor Force | Age 25-29 |
| Alsatians | 0.7 /100 | #241 | Tragic 83.9% |
| U.S. Virgin Islanders | 0.6 /100 | #242 | Tragic 83.8% |
| Salvadorans | 0.5 /100 | #243 | Tragic 83.8% |
| Immigrants | Jamaica | 0.4 /100 | #244 | Tragic 83.8% |
| Iroquois | 0.4 /100 | #245 | Tragic 83.8% |
| Cree | 0.3 /100 | #246 | Tragic 83.8% |
| Immigrants | El Salvador | 0.3 /100 | #247 | Tragic 83.7% |
| Immigrants | Nonimmigrants | 0.3 /100 | #248 | Tragic 83.7% |
| Hmong | 0.3 /100 | #249 | Tragic 83.7% |
| Central Americans | 0.2 /100 | #250 | Tragic 83.7% |
| Bahamians | 0.2 /100 | #251 | Tragic 83.7% |
| Guatemalans | 0.2 /100 | #252 | Tragic 83.7% |
| Immigrants | Trinidad and Tobago | 0.2 /100 | #253 | Tragic 83.7% |
| Spaniards | 0.2 /100 | #254 | Tragic 83.7% |
| Haitians | 0.2 /100 | #255 | Tragic 83.7% |
Demographics Similar to Yup'ik by In Labor Force | Age 25-29
In terms of in labor force | age 25-29, the demographic groups most similar to Yup'ik are Pima (74.3%, a difference of 1.7%), Navajo (74.6%, a difference of 2.2%), Hopi (76.5%, a difference of 4.8%), Arapaho (76.6%, a difference of 4.8%), and Pueblo (77.5%, a difference of 6.1%).
| Demographics | Rating | Rank | In Labor Force | Age 25-29 |
| Sioux | 0.0 /100 | #333 | Tragic 79.7% |
| Yuman | 0.0 /100 | #334 | Tragic 79.3% |
| Natives/Alaskans | 0.0 /100 | #335 | Tragic 79.3% |
| Apache | 0.0 /100 | #336 | Tragic 79.2% |
| Crow | 0.0 /100 | #337 | Tragic 78.6% |
| Lumbee | 0.0 /100 | #338 | Tragic 78.3% |
| Immigrants | Yemen | 0.0 /100 | #339 | Tragic 78.2% |
| Paiute | 0.0 /100 | #340 | Tragic 78.1% |
| Tohono O'odham | 0.0 /100 | #341 | Tragic 77.5% |
| Pueblo | 0.0 /100 | #342 | Tragic 77.5% |
| Arapaho | 0.0 /100 | #343 | Tragic 76.6% |
| Hopi | 0.0 /100 | #344 | Tragic 76.5% |
| Navajo | 0.0 /100 | #345 | Tragic 74.6% |
| Pima | 0.0 /100 | #346 | Tragic 74.3% |
| Yup'ik | 0.0 /100 | #347 | Tragic 73.1% |