Houma vs Yup'ik Median Household Income
COMPARE
Houma
Yup'ik
Median Household Income
Median Household Income Comparison
Houma
Yup'ik
$62,575
MEDIAN HOUSEHOLD INCOME
0.0/ 100
METRIC RATING
343rd/ 347
METRIC RANK
$69,695
MEDIAN HOUSEHOLD INCOME
0.0/ 100
METRIC RATING
324th/ 347
METRIC RANK
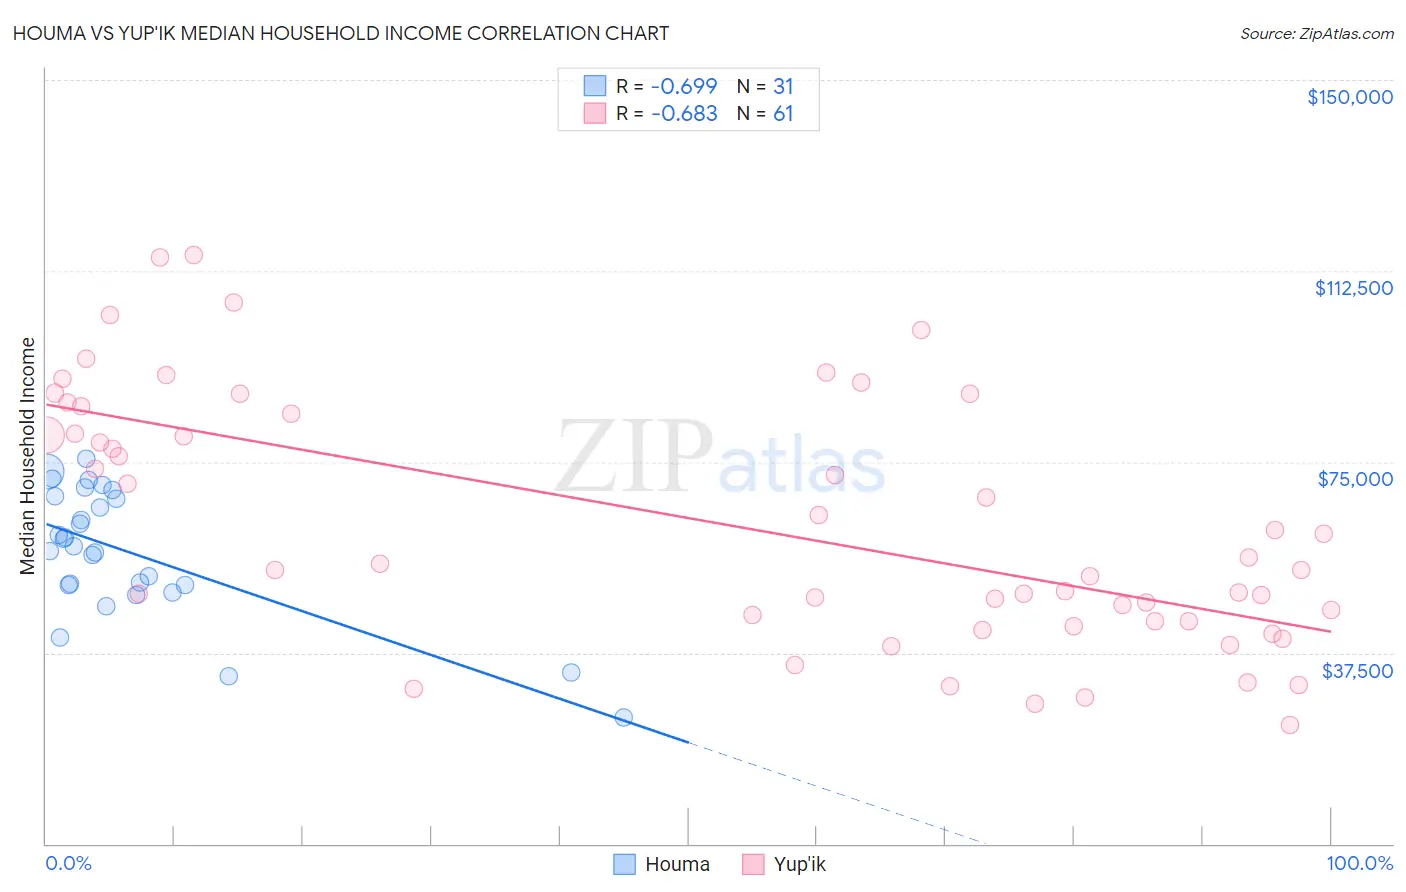
Houma vs Yup'ik Median Household Income Correlation Chart
The statistical analysis conducted on geographies consisting of 36,792,126 people shows a significant negative correlation between the proportion of Houma and median household income in the United States with a correlation coefficient (R) of -0.699 and weighted average of $62,575. Similarly, the statistical analysis conducted on geographies consisting of 39,952,449 people shows a significant negative correlation between the proportion of Yup'ik and median household income in the United States with a correlation coefficient (R) of -0.683 and weighted average of $69,695, a difference of 11.4%.
Median Household Income Correlation Summary
| Measurement | Houma | Yup'ik |
| Minimum | $24,706 | $23,333 |
| Maximum | $75,521 | $115,625 |
| Range | $50,815 | $92,292 |
| Mean | $57,222 | $62,948 |
| Median | $58,380 | $55,000 |
| Interquartile 25% (IQ1) | $50,766 | $43,673 |
| Interquartile 75% (IQ3) | $68,165 | $85,198 |
| Interquartile Range (IQR) | $17,398 | $41,525 |
| Standard Deviation (Sample) | $12,629 | $24,365 |
| Standard Deviation (Population) | $12,424 | $24,165 |
Demographics Similar to Houma and Yup'ik by Median Household Income
In terms of median household income, the demographic groups most similar to Houma are Pima ($63,262, a difference of 1.1%), Crow ($63,681, a difference of 1.8%), Pueblo ($64,692, a difference of 3.4%), Hopi ($65,043, a difference of 3.9%), and Immigrants from Yemen ($65,194, a difference of 4.2%). Similarly, the demographic groups most similar to Yup'ik are Bahamian ($69,726, a difference of 0.040%), Seminole ($69,420, a difference of 0.40%), Yuman ($68,743, a difference of 1.4%), Immigrants from Cuba ($68,461, a difference of 1.8%), and Menominee ($68,423, a difference of 1.9%).
| Demographics | Rating | Rank | Median Household Income |
| Bahamians | 0.0 /100 | #323 | Tragic $69,726 |
| Yup'ik | 0.0 /100 | #324 | Tragic $69,695 |
| Seminole | 0.0 /100 | #325 | Tragic $69,420 |
| Yuman | 0.0 /100 | #326 | Tragic $68,743 |
| Immigrants | Cuba | 0.0 /100 | #327 | Tragic $68,461 |
| Menominee | 0.0 /100 | #328 | Tragic $68,423 |
| Dutch West Indians | 0.0 /100 | #329 | Tragic $68,412 |
| Arapaho | 0.0 /100 | #330 | Tragic $67,965 |
| Natives/Alaskans | 0.0 /100 | #331 | Tragic $67,879 |
| Sioux | 0.0 /100 | #332 | Tragic $67,792 |
| Creek | 0.0 /100 | #333 | Tragic $67,715 |
| Blacks/African Americans | 0.0 /100 | #334 | Tragic $67,573 |
| Cheyenne | 0.0 /100 | #335 | Tragic $66,974 |
| Immigrants | Congo | 0.0 /100 | #336 | Tragic $66,768 |
| Kiowa | 0.0 /100 | #337 | Tragic $65,914 |
| Immigrants | Yemen | 0.0 /100 | #338 | Tragic $65,194 |
| Hopi | 0.0 /100 | #339 | Tragic $65,043 |
| Pueblo | 0.0 /100 | #340 | Tragic $64,692 |
| Crow | 0.0 /100 | #341 | Tragic $63,681 |
| Pima | 0.0 /100 | #342 | Tragic $63,262 |
| Houma | 0.0 /100 | #343 | Tragic $62,575 |