Nonimmigrants vs Finnish Median Household Income
COMPARE
Nonimmigrants
Finnish
Median Household Income
Median Household Income Comparison
Nonimmigrants
Finns
$79,429
MEDIAN HOUSEHOLD INCOME
2.6/ 100
METRIC RATING
241st/ 347
METRIC RANK
$83,607
MEDIAN HOUSEHOLD INCOME
27.7/ 100
METRIC RATING
193rd/ 347
METRIC RANK
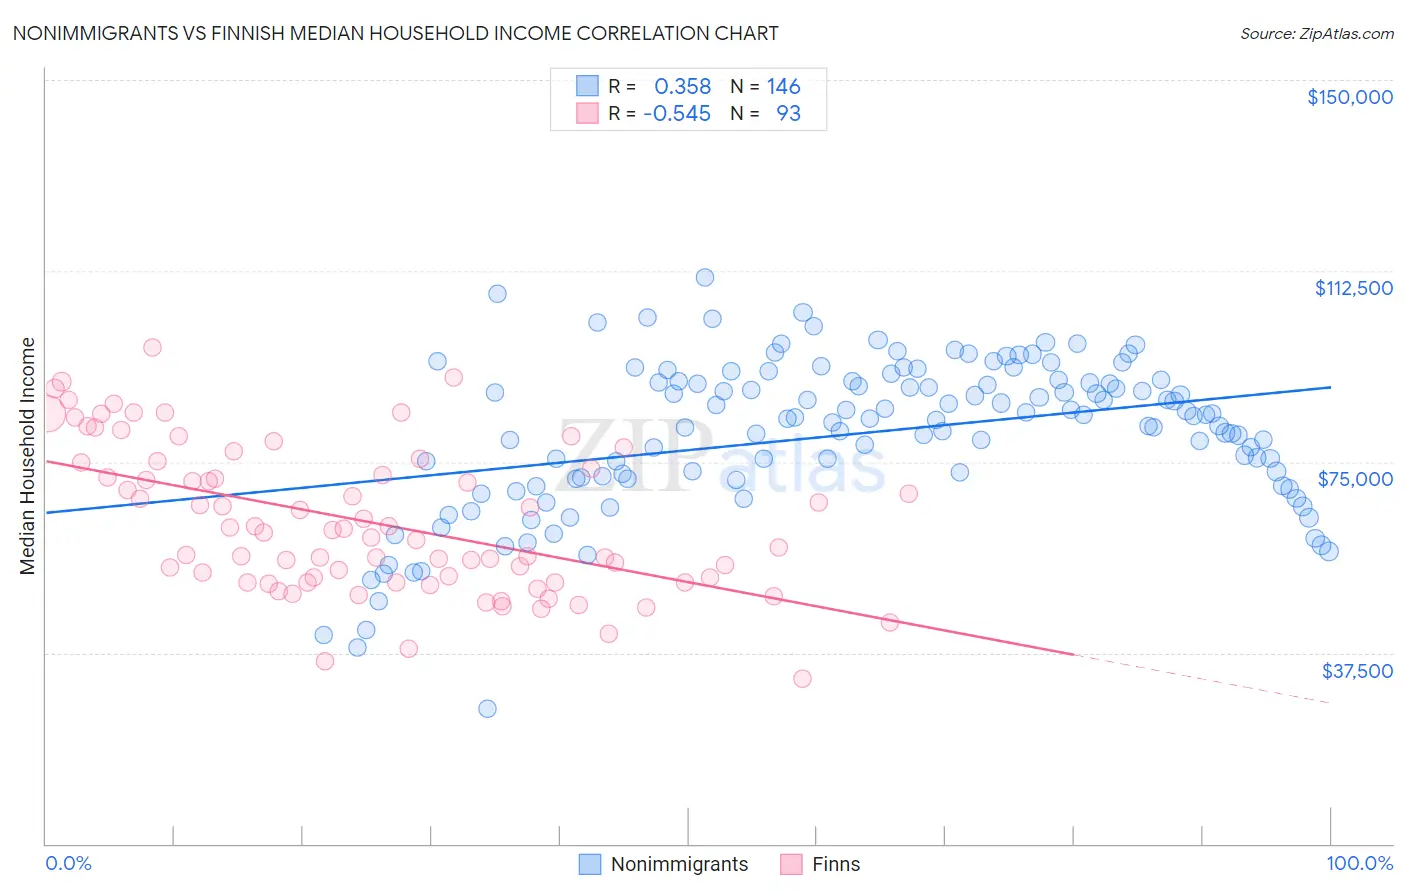
Nonimmigrants vs Finnish Median Household Income Correlation Chart
The statistical analysis conducted on geographies consisting of 582,891,477 people shows a mild positive correlation between the proportion of Nonimmigrants and median household income in the United States with a correlation coefficient (R) of 0.358 and weighted average of $79,429. Similarly, the statistical analysis conducted on geographies consisting of 404,464,617 people shows a substantial negative correlation between the proportion of Finns and median household income in the United States with a correlation coefficient (R) of -0.545 and weighted average of $83,607, a difference of 5.3%.
Median Household Income Correlation Summary
| Measurement | Nonimmigrants | Finnish |
| Minimum | $26,558 | $32,321 |
| Maximum | $111,218 | $97,373 |
| Range | $84,660 | $65,052 |
| Mean | $80,540 | $63,204 |
| Median | $83,608 | $61,019 |
| Interquartile 25% (IQ1) | $71,762 | $51,350 |
| Interquartile 75% (IQ3) | $90,776 | $74,285 |
| Interquartile Range (IQR) | $19,014 | $22,935 |
| Standard Deviation (Sample) | $15,013 | $14,392 |
| Standard Deviation (Population) | $14,961 | $14,315 |
Similar Demographics by Median Household Income
Demographics Similar to Nonimmigrants by Median Household Income
In terms of median household income, the demographic groups most similar to Nonimmigrants are Immigrants from Western Africa ($79,490, a difference of 0.080%), Alaska Native ($79,509, a difference of 0.10%), Barbadian ($79,664, a difference of 0.30%), Nicaraguan ($79,737, a difference of 0.39%), and Immigrants from Sudan ($79,103, a difference of 0.41%).
| Demographics | Rating | Rank | Median Household Income |
| Immigrants | Ecuador | 4.5 /100 | #234 | Tragic $80,341 |
| Immigrants | Guyana | 4.5 /100 | #235 | Tragic $80,324 |
| Immigrants | Bosnia and Herzegovina | 3.4 /100 | #236 | Tragic $79,888 |
| Nicaraguans | 3.1 /100 | #237 | Tragic $79,737 |
| Barbadians | 3.0 /100 | #238 | Tragic $79,664 |
| Alaska Natives | 2.7 /100 | #239 | Tragic $79,509 |
| Immigrants | Western Africa | 2.7 /100 | #240 | Tragic $79,490 |
| Immigrants | Nonimmigrants | 2.6 /100 | #241 | Tragic $79,429 |
| Immigrants | Sudan | 2.1 /100 | #242 | Tragic $79,103 |
| Immigrants | Barbados | 1.9 /100 | #243 | Tragic $78,989 |
| Marshallese | 1.9 /100 | #244 | Tragic $78,930 |
| Inupiat | 1.8 /100 | #245 | Tragic $78,841 |
| Central Americans | 1.7 /100 | #246 | Tragic $78,803 |
| Immigrants | Burma/Myanmar | 1.6 /100 | #247 | Tragic $78,682 |
| Sudanese | 1.5 /100 | #248 | Tragic $78,529 |
Demographics Similar to Finns by Median Household Income
In terms of median household income, the demographic groups most similar to Finns are Welsh ($83,628, a difference of 0.030%), Ghanaian ($83,582, a difference of 0.030%), Immigrants from Armenia ($83,555, a difference of 0.060%), French ($83,468, a difference of 0.17%), and Iraqi ($83,753, a difference of 0.18%).
| Demographics | Rating | Rank | Median Household Income |
| Puget Sound Salish | 33.2 /100 | #186 | Fair $84,011 |
| Belgians | 33.2 /100 | #187 | Fair $84,008 |
| Tlingit-Haida | 32.6 /100 | #188 | Fair $83,968 |
| Immigrants | Colombia | 31.7 /100 | #189 | Fair $83,902 |
| Slovaks | 30.2 /100 | #190 | Fair $83,798 |
| Iraqis | 29.6 /100 | #191 | Fair $83,753 |
| Welsh | 28.0 /100 | #192 | Fair $83,628 |
| Finns | 27.7 /100 | #193 | Fair $83,607 |
| Ghanaians | 27.4 /100 | #194 | Fair $83,582 |
| Immigrants | Armenia | 27.0 /100 | #195 | Fair $83,555 |
| French | 26.0 /100 | #196 | Fair $83,468 |
| Aleuts | 25.7 /100 | #197 | Fair $83,446 |
| Japanese | 25.1 /100 | #198 | Fair $83,395 |
| Germans | 24.6 /100 | #199 | Fair $83,358 |
| Tsimshian | 24.5 /100 | #200 | Fair $83,346 |