Delaware vs Yup'ik Median Household Income
COMPARE
Delaware
Yup'ik
Median Household Income
Median Household Income Comparison
Delaware
Yup'ik
$80,527
MEDIAN HOUSEHOLD INCOME
5.0/ 100
METRIC RATING
229th/ 347
METRIC RANK
$69,695
MEDIAN HOUSEHOLD INCOME
0.0/ 100
METRIC RATING
324th/ 347
METRIC RANK
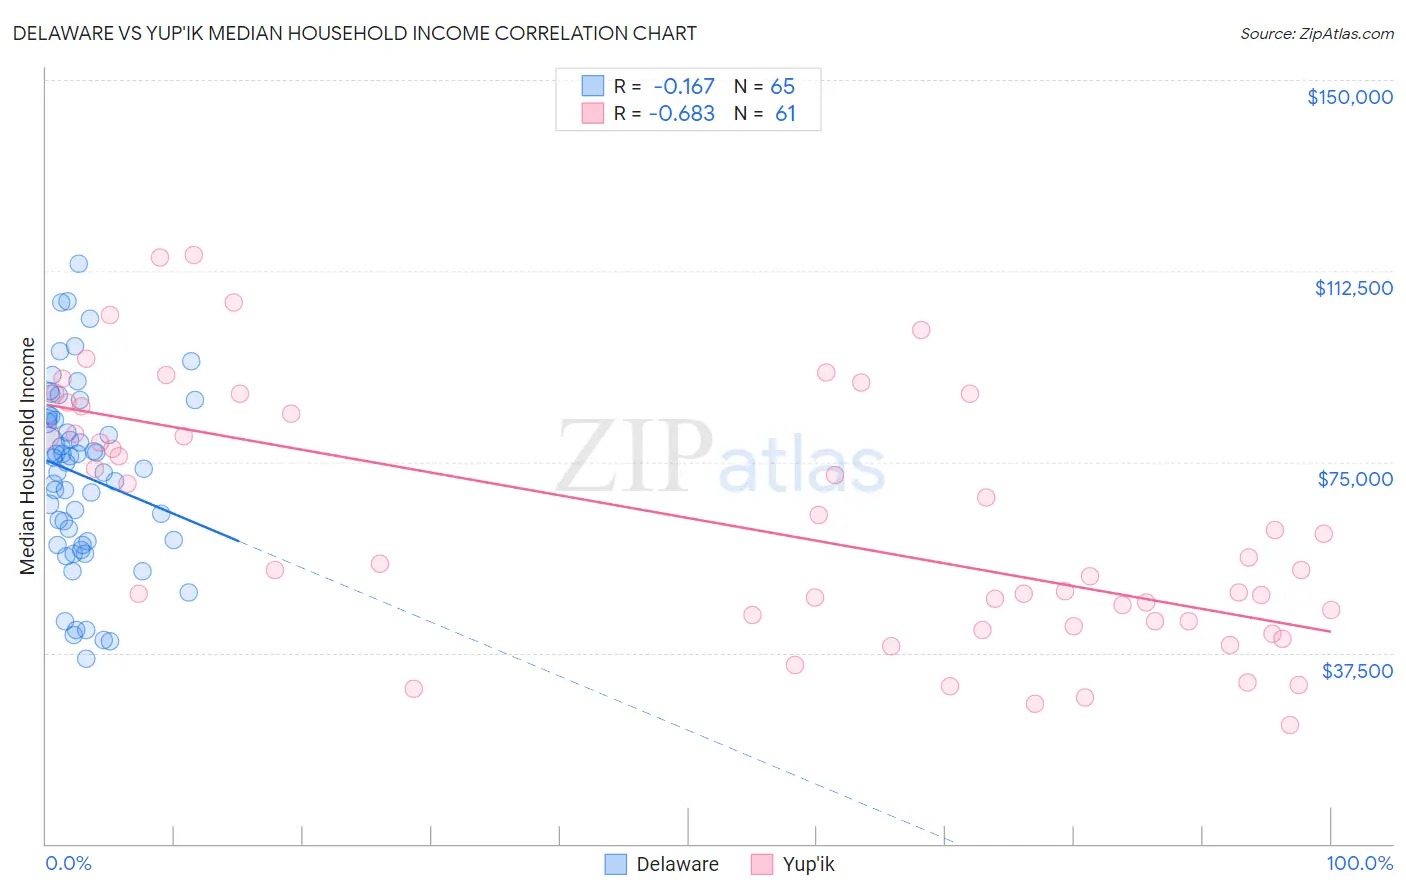
Delaware vs Yup'ik Median Household Income Correlation Chart
The statistical analysis conducted on geographies consisting of 96,222,020 people shows a poor negative correlation between the proportion of Delaware and median household income in the United States with a correlation coefficient (R) of -0.167 and weighted average of $80,527. Similarly, the statistical analysis conducted on geographies consisting of 39,952,449 people shows a significant negative correlation between the proportion of Yup'ik and median household income in the United States with a correlation coefficient (R) of -0.683 and weighted average of $69,695, a difference of 15.5%.
Median Household Income Correlation Summary
| Measurement | Delaware | Yup'ik |
| Minimum | $36,250 | $23,333 |
| Maximum | $113,889 | $115,625 |
| Range | $77,639 | $92,292 |
| Mean | $72,395 | $62,948 |
| Median | $74,896 | $55,000 |
| Interquartile 25% (IQ1) | $59,089 | $43,673 |
| Interquartile 75% (IQ3) | $83,725 | $85,198 |
| Interquartile Range (IQR) | $24,635 | $41,525 |
| Standard Deviation (Sample) | $17,722 | $24,365 |
| Standard Deviation (Population) | $17,585 | $24,165 |
Similar Demographics by Median Household Income
Demographics Similar to Delaware by Median Household Income
In terms of median household income, the demographic groups most similar to Delaware are Bermudan ($80,406, a difference of 0.15%), Trinidadian and Tobagonian ($80,402, a difference of 0.16%), Immigrants from Trinidad and Tobago ($80,373, a difference of 0.19%), Immigrants from the Azores ($80,357, a difference of 0.21%), and Immigrants from Ecuador ($80,341, a difference of 0.23%).
| Demographics | Rating | Rank | Median Household Income |
| Immigrants | Nigeria | 7.7 /100 | #222 | Tragic $81,236 |
| Immigrants | El Salvador | 7.6 /100 | #223 | Tragic $81,213 |
| Malaysians | 7.0 /100 | #224 | Tragic $81,064 |
| Scotch-Irish | 6.6 /100 | #225 | Tragic $80,972 |
| Immigrants | Panama | 6.2 /100 | #226 | Tragic $80,873 |
| Guyanese | 5.7 /100 | #227 | Tragic $80,734 |
| Immigrants | Bangladesh | 5.7 /100 | #228 | Tragic $80,722 |
| Delaware | 5.0 /100 | #229 | Tragic $80,527 |
| Bermudans | 4.7 /100 | #230 | Tragic $80,406 |
| Trinidadians and Tobagonians | 4.7 /100 | #231 | Tragic $80,402 |
| Immigrants | Trinidad and Tobago | 4.6 /100 | #232 | Tragic $80,373 |
| Immigrants | Azores | 4.5 /100 | #233 | Tragic $80,357 |
| Immigrants | Ecuador | 4.5 /100 | #234 | Tragic $80,341 |
| Immigrants | Guyana | 4.5 /100 | #235 | Tragic $80,324 |
| Immigrants | Bosnia and Herzegovina | 3.4 /100 | #236 | Tragic $79,888 |
Demographics Similar to Yup'ik by Median Household Income
In terms of median household income, the demographic groups most similar to Yup'ik are Bahamian ($69,726, a difference of 0.040%), Choctaw ($69,947, a difference of 0.36%), Seminole ($69,420, a difference of 0.40%), Chickasaw ($70,005, a difference of 0.45%), and Colville ($70,094, a difference of 0.57%).
| Demographics | Rating | Rank | Median Household Income |
| Cajuns | 0.0 /100 | #317 | Tragic $70,605 |
| Chippewa | 0.0 /100 | #318 | Tragic $70,539 |
| Immigrants | Dominican Republic | 0.0 /100 | #319 | Tragic $70,208 |
| Colville | 0.0 /100 | #320 | Tragic $70,094 |
| Chickasaw | 0.0 /100 | #321 | Tragic $70,005 |
| Choctaw | 0.0 /100 | #322 | Tragic $69,947 |
| Bahamians | 0.0 /100 | #323 | Tragic $69,726 |
| Yup'ik | 0.0 /100 | #324 | Tragic $69,695 |
| Seminole | 0.0 /100 | #325 | Tragic $69,420 |
| Yuman | 0.0 /100 | #326 | Tragic $68,743 |
| Immigrants | Cuba | 0.0 /100 | #327 | Tragic $68,461 |
| Menominee | 0.0 /100 | #328 | Tragic $68,423 |
| Dutch West Indians | 0.0 /100 | #329 | Tragic $68,412 |
| Arapaho | 0.0 /100 | #330 | Tragic $67,965 |
| Natives/Alaskans | 0.0 /100 | #331 | Tragic $67,879 |