Immigrants from West Indies vs Immigrants from Asia Median Female Earnings
COMPARE
Immigrants from West Indies
Immigrants from Asia
Median Female Earnings
Median Female Earnings Comparison
Immigrants from West Indies
Immigrants from Asia
$39,441
MEDIAN FEMALE EARNINGS
36.9/ 100
METRIC RATING
185th/ 347
METRIC RANK
$44,198
MEDIAN FEMALE EARNINGS
100.0/ 100
METRIC RATING
33rd/ 347
METRIC RANK
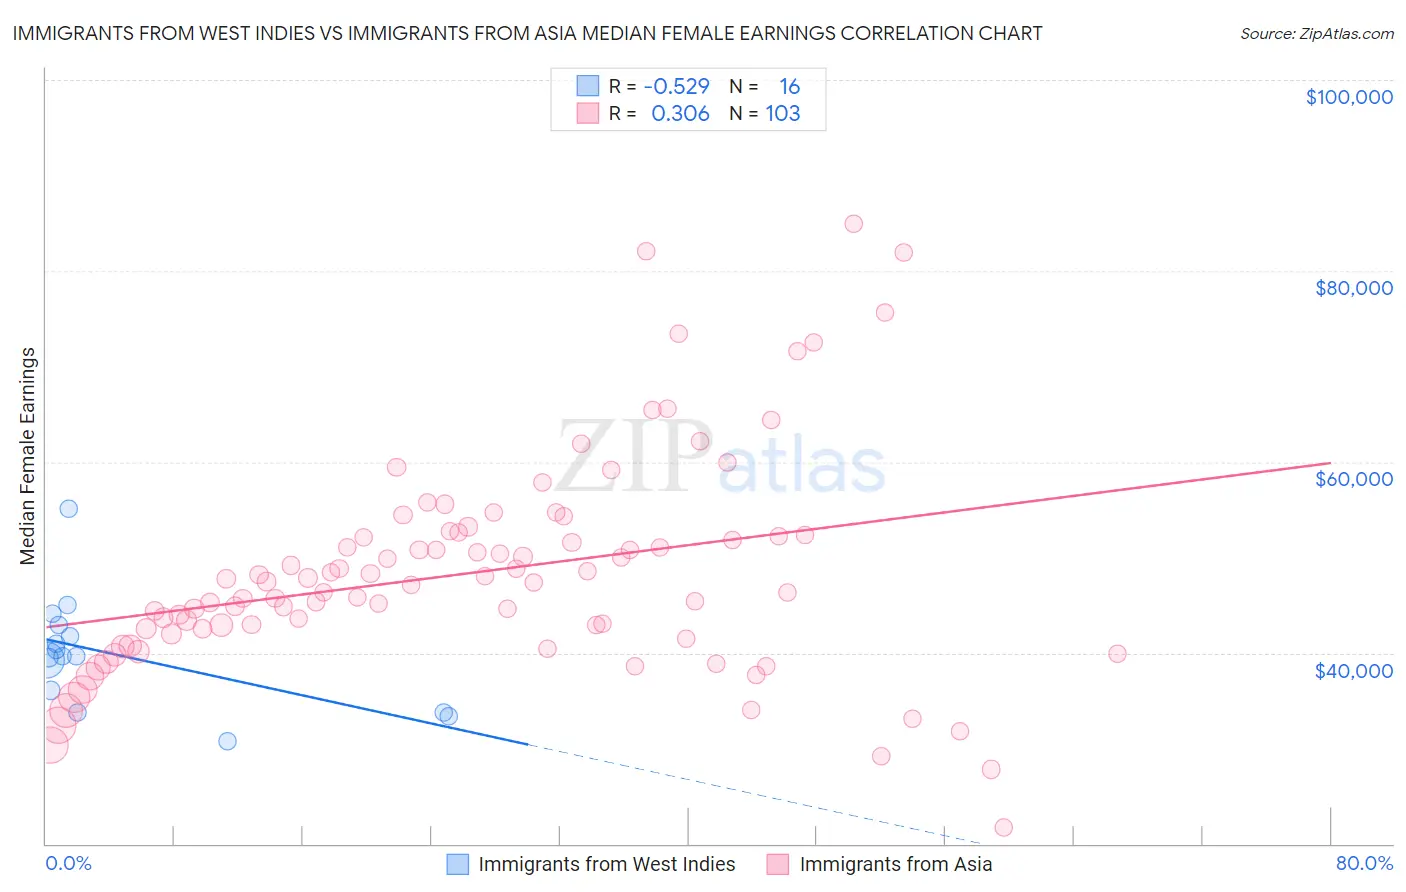
Immigrants from West Indies vs Immigrants from Asia Median Female Earnings Correlation Chart
The statistical analysis conducted on geographies consisting of 72,414,276 people shows a substantial negative correlation between the proportion of Immigrants from West Indies and median female earnings in the United States with a correlation coefficient (R) of -0.529 and weighted average of $39,441. Similarly, the statistical analysis conducted on geographies consisting of 548,277,382 people shows a mild positive correlation between the proportion of Immigrants from Asia and median female earnings in the United States with a correlation coefficient (R) of 0.306 and weighted average of $44,198, a difference of 12.1%.
Median Female Earnings Correlation Summary
| Measurement | Immigrants from West Indies | Immigrants from Asia |
| Minimum | $30,781 | $21,667 |
| Maximum | $55,116 | $84,949 |
| Range | $24,335 | $63,282 |
| Mean | $39,738 | $48,373 |
| Median | $39,670 | $47,404 |
| Interquartile 25% (IQ1) | $34,901 | $41,959 |
| Interquartile 75% (IQ3) | $42,316 | $52,302 |
| Interquartile Range (IQR) | $7,415 | $10,343 |
| Standard Deviation (Sample) | $5,811 | $11,346 |
| Standard Deviation (Population) | $5,627 | $11,291 |
Similar Demographics by Median Female Earnings
Demographics Similar to Immigrants from West Indies by Median Female Earnings
In terms of median female earnings, the demographic groups most similar to Immigrants from West Indies are Colombian ($39,439, a difference of 0.0%), European ($39,457, a difference of 0.040%), Swedish ($39,421, a difference of 0.050%), Bermudan ($39,418, a difference of 0.060%), and Senegalese ($39,384, a difference of 0.14%).
| Demographics | Rating | Rank | Median Female Earnings |
| Slavs | 45.6 /100 | #178 | Average $39,613 |
| Immigrants | Germany | 45.1 /100 | #179 | Average $39,603 |
| Immigrants | Kenya | 41.6 /100 | #180 | Average $39,535 |
| Tsimshian | 41.4 /100 | #181 | Average $39,530 |
| Tlingit-Haida | 40.5 /100 | #182 | Average $39,513 |
| Hungarians | 40.3 /100 | #183 | Average $39,510 |
| Europeans | 37.7 /100 | #184 | Fair $39,457 |
| Immigrants | West Indies | 36.9 /100 | #185 | Fair $39,441 |
| Colombians | 36.9 /100 | #186 | Fair $39,439 |
| Swedes | 36.0 /100 | #187 | Fair $39,421 |
| Bermudans | 35.9 /100 | #188 | Fair $39,418 |
| Senegalese | 34.2 /100 | #189 | Fair $39,384 |
| Puget Sound Salish | 33.9 /100 | #190 | Fair $39,376 |
| Immigrants | Western Africa | 32.7 /100 | #191 | Fair $39,351 |
| Immigrants | Immigrants | 31.7 /100 | #192 | Fair $39,328 |
Demographics Similar to Immigrants from Asia by Median Female Earnings
In terms of median female earnings, the demographic groups most similar to Immigrants from Asia are Russian ($44,169, a difference of 0.070%), Immigrants from Sri Lanka ($44,161, a difference of 0.080%), Immigrants from Turkey ($44,066, a difference of 0.30%), Immigrants from Northern Europe ($44,366, a difference of 0.38%), and Immigrants from Switzerland ($43,996, a difference of 0.46%).
| Demographics | Rating | Rank | Median Female Earnings |
| Immigrants | Belarus | 100.0 /100 | #26 | Exceptional $44,757 |
| Turks | 100.0 /100 | #27 | Exceptional $44,695 |
| Immigrants | Russia | 100.0 /100 | #28 | Exceptional $44,680 |
| Immigrants | Belgium | 100.0 /100 | #29 | Exceptional $44,587 |
| Asians | 100.0 /100 | #30 | Exceptional $44,586 |
| Immigrants | France | 100.0 /100 | #31 | Exceptional $44,541 |
| Immigrants | Northern Europe | 100.0 /100 | #32 | Exceptional $44,366 |
| Immigrants | Asia | 100.0 /100 | #33 | Exceptional $44,198 |
| Russians | 100.0 /100 | #34 | Exceptional $44,169 |
| Immigrants | Sri Lanka | 100.0 /100 | #35 | Exceptional $44,161 |
| Immigrants | Turkey | 100.0 /100 | #36 | Exceptional $44,066 |
| Immigrants | Switzerland | 100.0 /100 | #37 | Exceptional $43,996 |
| Latvians | 100.0 /100 | #38 | Exceptional $43,941 |
| Israelis | 100.0 /100 | #39 | Exceptional $43,852 |
| Immigrants | Malaysia | 100.0 /100 | #40 | Exceptional $43,835 |