Nonimmigrants vs Immigrants from Asia 11th Grade
COMPARE
Nonimmigrants
Immigrants from Asia
11th Grade
11th Grade Comparison
Nonimmigrants
Immigrants from Asia
92.7%
11TH GRADE
66.6/ 100
METRIC RATING
163rd/ 347
METRIC RANK
92.4%
11TH GRADE
37.4/ 100
METRIC RATING
184th/ 347
METRIC RANK
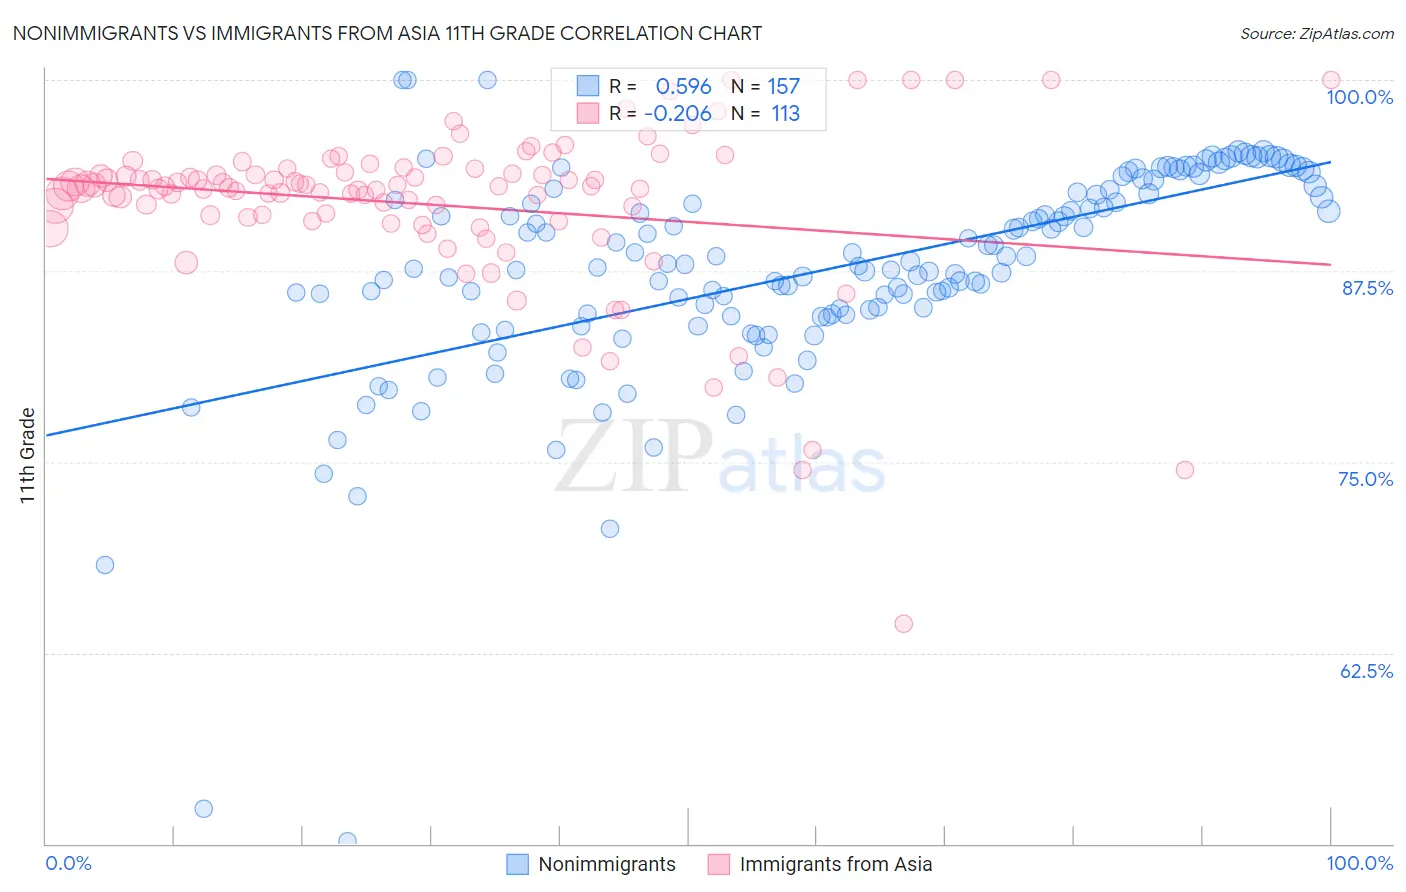
Nonimmigrants vs Immigrants from Asia 11th Grade Correlation Chart
The statistical analysis conducted on geographies consisting of 585,371,149 people shows a substantial positive correlation between the proportion of Nonimmigrants and percentage of population with at least 11th grade education in the United States with a correlation coefficient (R) of 0.596 and weighted average of 92.7%. Similarly, the statistical analysis conducted on geographies consisting of 549,170,438 people shows a weak negative correlation between the proportion of Immigrants from Asia and percentage of population with at least 11th grade education in the United States with a correlation coefficient (R) of -0.206 and weighted average of 92.4%, a difference of 0.30%.
11th Grade Correlation Summary
| Measurement | Nonimmigrants | Immigrants from Asia |
| Minimum | 50.2% | 64.4% |
| Maximum | 100.0% | 100.0% |
| Range | 49.8% | 35.6% |
| Mean | 87.5% | 91.8% |
| Median | 87.8% | 93.0% |
| Interquartile 25% (IQ1) | 84.6% | 90.9% |
| Interquartile 75% (IQ3) | 92.5% | 94.1% |
| Interquartile Range (IQR) | 7.9% | 3.1% |
| Standard Deviation (Sample) | 7.1% | 5.4% |
| Standard Deviation (Population) | 7.1% | 5.4% |
Similar Demographics by 11th Grade
Demographics Similar to Nonimmigrants by 11th Grade
In terms of 11th grade, the demographic groups most similar to Nonimmigrants are Spanish (92.7%, a difference of 0.0%), Paraguayan (92.7%, a difference of 0.020%), Immigrants from Iraq (92.6%, a difference of 0.030%), Immigrants from Argentina (92.7%, a difference of 0.040%), and Immigrants from Lebanon (92.7%, a difference of 0.050%).
| Demographics | Rating | Rank | 11th Grade |
| Immigrants | Spain | 73.0 /100 | #156 | Good 92.7% |
| Immigrants | Eastern Asia | 72.6 /100 | #157 | Good 92.7% |
| Immigrants | Venezuela | 72.0 /100 | #158 | Good 92.7% |
| Americans | 71.7 /100 | #159 | Good 92.7% |
| Immigrants | Lebanon | 70.7 /100 | #160 | Good 92.7% |
| Immigrants | Argentina | 69.8 /100 | #161 | Good 92.7% |
| Paraguayans | 68.7 /100 | #162 | Good 92.7% |
| Immigrants | Nonimmigrants | 66.6 /100 | #163 | Good 92.7% |
| Spanish | 66.2 /100 | #164 | Good 92.7% |
| Immigrants | Iraq | 63.7 /100 | #165 | Good 92.6% |
| Bermudans | 62.3 /100 | #166 | Good 92.6% |
| Alsatians | 60.2 /100 | #167 | Good 92.6% |
| Sierra Leoneans | 58.7 /100 | #168 | Average 92.6% |
| Immigrants | Albania | 57.8 /100 | #169 | Average 92.6% |
| Immigrants | Northern Africa | 57.3 /100 | #170 | Average 92.6% |
Demographics Similar to Immigrants from Asia by 11th Grade
In terms of 11th grade, the demographic groups most similar to Immigrants from Asia are Immigrants from Malaysia (92.4%, a difference of 0.0%), Immigrants from Morocco (92.4%, a difference of 0.010%), Immigrants from Nepal (92.4%, a difference of 0.010%), Arapaho (92.4%, a difference of 0.020%), and Inupiat (92.4%, a difference of 0.030%).
| Demographics | Rating | Rank | 11th Grade |
| Guamanians/Chamorros | 45.0 /100 | #177 | Average 92.5% |
| Sudanese | 43.4 /100 | #178 | Average 92.5% |
| Creek | 40.9 /100 | #179 | Average 92.4% |
| Inupiat | 40.7 /100 | #180 | Average 92.4% |
| Cherokee | 40.7 /100 | #181 | Average 92.4% |
| Immigrants | Morocco | 38.6 /100 | #182 | Fair 92.4% |
| Immigrants | Malaysia | 37.6 /100 | #183 | Fair 92.4% |
| Immigrants | Asia | 37.4 /100 | #184 | Fair 92.4% |
| Immigrants | Nepal | 36.4 /100 | #185 | Fair 92.4% |
| Arapaho | 35.1 /100 | #186 | Fair 92.4% |
| Immigrants | Western Asia | 35.0 /100 | #187 | Fair 92.4% |
| Immigrants | Indonesia | 33.7 /100 | #188 | Fair 92.4% |
| Immigrants | Chile | 33.3 /100 | #189 | Fair 92.4% |
| Chickasaw | 31.4 /100 | #190 | Fair 92.3% |
| French American Indians | 30.8 /100 | #191 | Fair 92.3% |