Nonimmigrants vs Immigrants from Argentina Per Capita Income
COMPARE
Nonimmigrants
Immigrants from Argentina
Per Capita Income
Per Capita Income Comparison
Nonimmigrants
Immigrants from Argentina
$40,669
PER CAPITA INCOME
3.4/ 100
METRIC RATING
236th/ 347
METRIC RANK
$49,627
PER CAPITA INCOME
99.9/ 100
METRIC RATING
64th/ 347
METRIC RANK
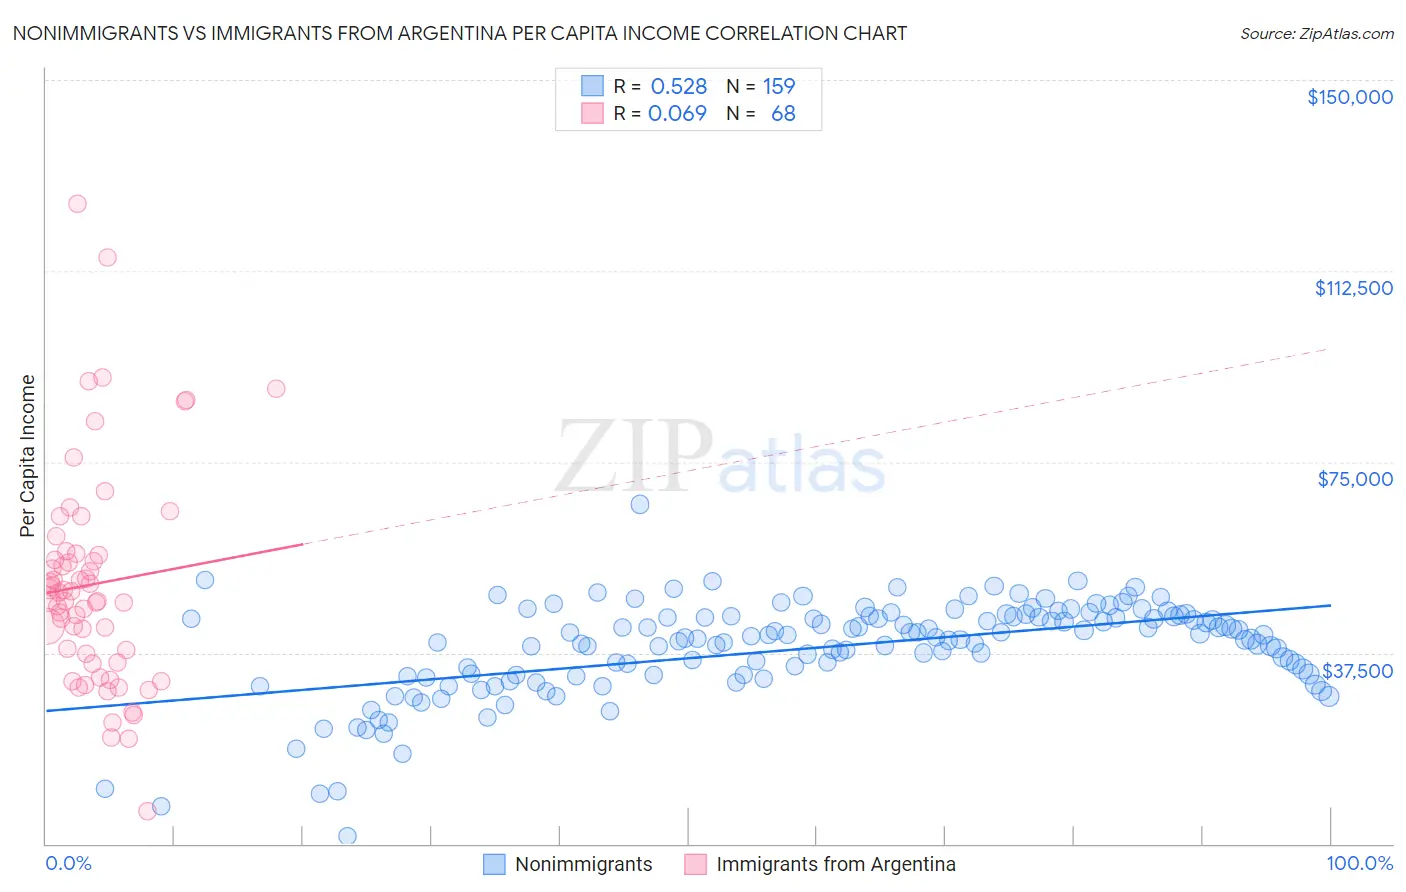
Nonimmigrants vs Immigrants from Argentina Per Capita Income Correlation Chart
The statistical analysis conducted on geographies consisting of 585,383,873 people shows a substantial positive correlation between the proportion of Nonimmigrants and per capita income in the United States with a correlation coefficient (R) of 0.528 and weighted average of $40,669. Similarly, the statistical analysis conducted on geographies consisting of 264,438,412 people shows a slight positive correlation between the proportion of Immigrants from Argentina and per capita income in the United States with a correlation coefficient (R) of 0.069 and weighted average of $49,627, a difference of 22.0%.
Per Capita Income Correlation Summary
| Measurement | Nonimmigrants | Immigrants from Argentina |
| Minimum | $1,397 | $6,333 |
| Maximum | $66,659 | $125,688 |
| Range | $65,262 | $119,355 |
| Mean | $38,443 | $51,000 |
| Median | $40,388 | $48,720 |
| Interquartile 25% (IQ1) | $33,053 | $36,471 |
| Interquartile 75% (IQ3) | $44,574 | $56,811 |
| Interquartile Range (IQR) | $11,521 | $20,340 |
| Standard Deviation (Sample) | $9,433 | $21,495 |
| Standard Deviation (Population) | $9,403 | $21,336 |
Similar Demographics by Per Capita Income
Demographics Similar to Nonimmigrants by Per Capita Income
In terms of per capita income, the demographic groups most similar to Nonimmigrants are Immigrants from Guyana ($40,742, a difference of 0.18%), Immigrants from West Indies ($40,763, a difference of 0.23%), Delaware ($40,778, a difference of 0.27%), Immigrants from Cambodia ($40,434, a difference of 0.58%), and Guyanese ($40,949, a difference of 0.69%).
| Demographics | Rating | Rank | Per Capita Income |
| Nigerians | 4.9 /100 | #229 | Tragic $41,026 |
| Native Hawaiians | 4.9 /100 | #230 | Tragic $41,017 |
| Senegalese | 4.8 /100 | #231 | Tragic $41,000 |
| Guyanese | 4.5 /100 | #232 | Tragic $40,949 |
| Delaware | 3.8 /100 | #233 | Tragic $40,778 |
| Immigrants | West Indies | 3.7 /100 | #234 | Tragic $40,763 |
| Immigrants | Guyana | 3.6 /100 | #235 | Tragic $40,742 |
| Immigrants | Nonimmigrants | 3.4 /100 | #236 | Tragic $40,669 |
| Immigrants | Cambodia | 2.6 /100 | #237 | Tragic $40,434 |
| Somalis | 2.4 /100 | #238 | Tragic $40,367 |
| Tsimshian | 2.4 /100 | #239 | Tragic $40,344 |
| Immigrants | Nigeria | 2.3 /100 | #240 | Tragic $40,339 |
| British West Indians | 2.3 /100 | #241 | Tragic $40,330 |
| Immigrants | Western Africa | 2.2 /100 | #242 | Tragic $40,294 |
| German Russians | 2.2 /100 | #243 | Tragic $40,266 |
Demographics Similar to Immigrants from Argentina by Per Capita Income
In terms of per capita income, the demographic groups most similar to Immigrants from Argentina are Maltese ($49,640, a difference of 0.030%), Bolivian ($49,526, a difference of 0.20%), Immigrants from Asia ($49,741, a difference of 0.23%), Immigrants from Bulgaria ($49,482, a difference of 0.29%), and Immigrants from Romania ($49,463, a difference of 0.33%).
| Demographics | Rating | Rank | Per Capita Income |
| South Africans | 99.9 /100 | #57 | Exceptional $50,044 |
| Immigrants | Malaysia | 99.9 /100 | #58 | Exceptional $49,983 |
| Bhutanese | 99.9 /100 | #59 | Exceptional $49,894 |
| Immigrants | Scotland | 99.9 /100 | #60 | Exceptional $49,893 |
| Argentineans | 99.9 /100 | #61 | Exceptional $49,862 |
| Immigrants | Asia | 99.9 /100 | #62 | Exceptional $49,741 |
| Maltese | 99.9 /100 | #63 | Exceptional $49,640 |
| Immigrants | Argentina | 99.9 /100 | #64 | Exceptional $49,627 |
| Bolivians | 99.9 /100 | #65 | Exceptional $49,526 |
| Immigrants | Bulgaria | 99.9 /100 | #66 | Exceptional $49,482 |
| Immigrants | Romania | 99.9 /100 | #67 | Exceptional $49,463 |
| Lithuanians | 99.8 /100 | #68 | Exceptional $49,448 |
| Immigrants | Canada | 99.8 /100 | #69 | Exceptional $49,412 |
| Immigrants | Eastern Europe | 99.8 /100 | #70 | Exceptional $49,316 |
| Greeks | 99.8 /100 | #71 | Exceptional $49,309 |