Immigrants from Eritrea vs Immigrants from Argentina Median Female Earnings
COMPARE
Immigrants from Eritrea
Immigrants from Argentina
Median Female Earnings
Median Female Earnings Comparison
Immigrants from Eritrea
Immigrants from Argentina
$41,485
MEDIAN FEMALE EARNINGS
97.6/ 100
METRIC RATING
106th/ 347
METRIC RANK
$41,554
MEDIAN FEMALE EARNINGS
97.9/ 100
METRIC RATING
103rd/ 347
METRIC RANK
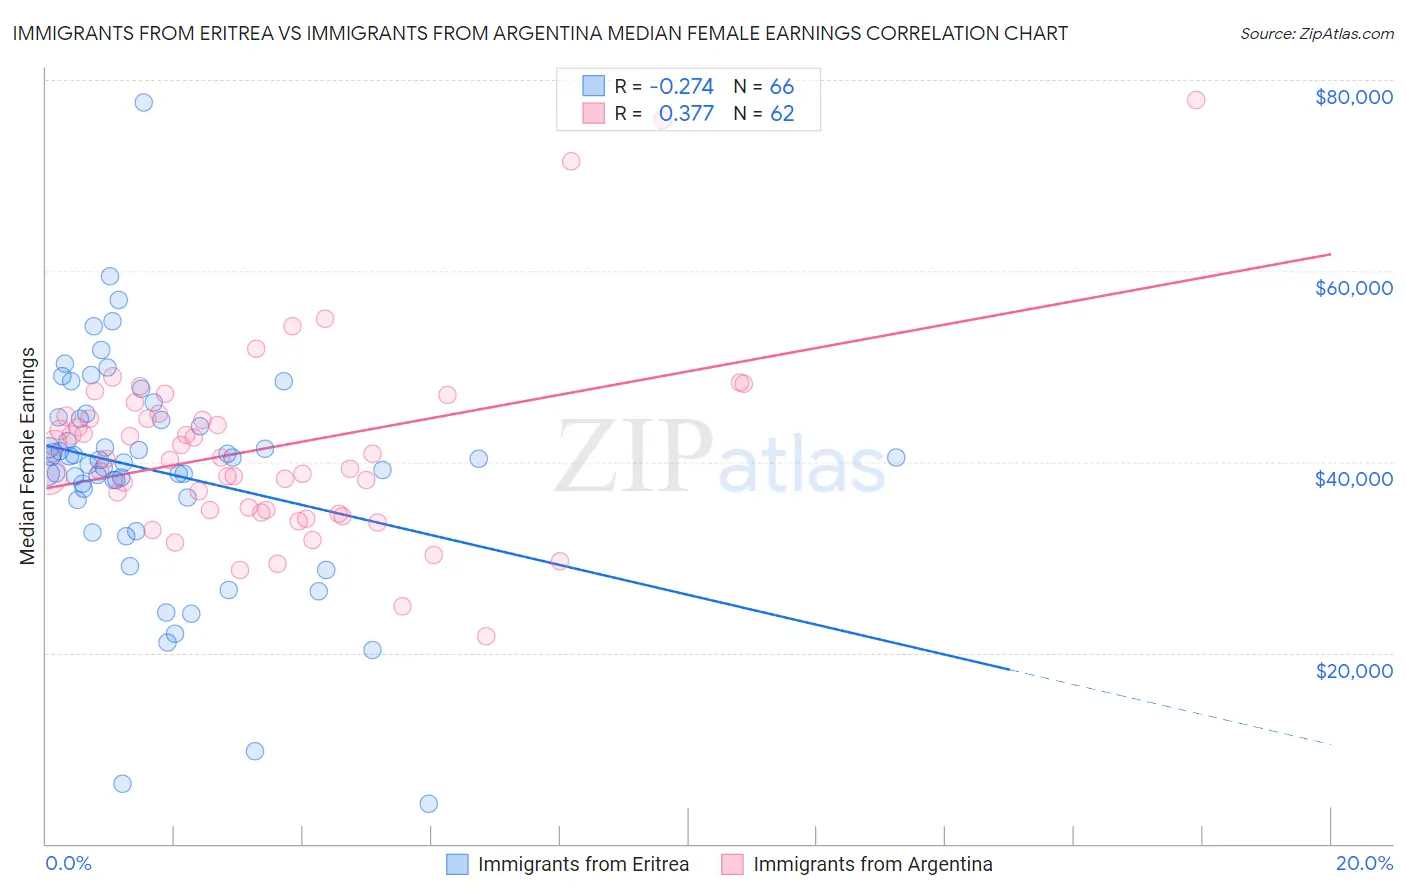
Immigrants from Eritrea vs Immigrants from Argentina Median Female Earnings Correlation Chart
The statistical analysis conducted on geographies consisting of 104,836,938 people shows a weak negative correlation between the proportion of Immigrants from Eritrea and median female earnings in the United States with a correlation coefficient (R) of -0.274 and weighted average of $41,485. Similarly, the statistical analysis conducted on geographies consisting of 264,373,843 people shows a mild positive correlation between the proportion of Immigrants from Argentina and median female earnings in the United States with a correlation coefficient (R) of 0.377 and weighted average of $41,554, a difference of 0.17%.
Median Female Earnings Correlation Summary
| Measurement | Immigrants from Eritrea | Immigrants from Argentina |
| Minimum | $4,132 | $21,743 |
| Maximum | $77,694 | $77,902 |
| Range | $73,562 | $56,159 |
| Mean | $38,981 | $41,489 |
| Median | $40,245 | $40,427 |
| Interquartile 25% (IQ1) | $36,285 | $34,985 |
| Interquartile 75% (IQ3) | $44,525 | $44,732 |
| Interquartile Range (IQR) | $8,239 | $9,747 |
| Standard Deviation (Sample) | $11,801 | $10,181 |
| Standard Deviation (Population) | $11,712 | $10,099 |
Demographics Similar to Immigrants from Eritrea and Immigrants from Argentina by Median Female Earnings
In terms of median female earnings, the demographic groups most similar to Immigrants from Eritrea are Palestinian ($41,484, a difference of 0.0%), Italian ($41,505, a difference of 0.050%), Jordanian ($41,464, a difference of 0.050%), Chinese ($41,461, a difference of 0.060%), and Immigrants from Zimbabwe ($41,527, a difference of 0.10%). Similarly, the demographic groups most similar to Immigrants from Argentina are Immigrants from Zimbabwe ($41,527, a difference of 0.060%), Italian ($41,505, a difference of 0.12%), Palestinian ($41,484, a difference of 0.17%), Immigrants from Poland ($41,630, a difference of 0.18%), and Jordanian ($41,464, a difference of 0.22%).
| Demographics | Rating | Rank | Median Female Earnings |
| Moroccans | 98.9 /100 | #94 | Exceptional $41,872 |
| Immigrants | Netherlands | 98.9 /100 | #95 | Exceptional $41,870 |
| South Africans | 98.8 /100 | #96 | Exceptional $41,825 |
| Immigrants | Hungary | 98.8 /100 | #97 | Exceptional $41,820 |
| Immigrants | Scotland | 98.7 /100 | #98 | Exceptional $41,771 |
| Immigrants | Barbados | 98.4 /100 | #99 | Exceptional $41,685 |
| Romanians | 98.3 /100 | #100 | Exceptional $41,663 |
| Immigrants | Fiji | 98.3 /100 | #101 | Exceptional $41,656 |
| Immigrants | Poland | 98.2 /100 | #102 | Exceptional $41,630 |
| Immigrants | Argentina | 97.9 /100 | #103 | Exceptional $41,554 |
| Immigrants | Zimbabwe | 97.8 /100 | #104 | Exceptional $41,527 |
| Italians | 97.7 /100 | #105 | Exceptional $41,505 |
| Immigrants | Eritrea | 97.6 /100 | #106 | Exceptional $41,485 |
| Palestinians | 97.6 /100 | #107 | Exceptional $41,484 |
| Jordanians | 97.5 /100 | #108 | Exceptional $41,464 |
| Chinese | 97.5 /100 | #109 | Exceptional $41,461 |
| Immigrants | Western Asia | 97.0 /100 | #110 | Exceptional $41,375 |
| Immigrants | Canada | 97.0 /100 | #111 | Exceptional $41,373 |
| Immigrants | North America | 96.7 /100 | #112 | Exceptional $41,319 |
| Macedonians | 96.4 /100 | #113 | Exceptional $41,286 |
| Immigrants | England | 96.4 /100 | #114 | Exceptional $41,277 |