Nicaraguan vs Italian Female Poverty Among 25-34 Year Olds

COMPARE

Nicaraguan
Race
Ancestry
AfghanAfricanAlaska NativeAlaskan AthabascanAlbanianAleutAlsatianAmericanApacheArabArapahoArgentineanArmenianAssyrian/Chaldean/SyriacAustralianAustrianBahamianBangladeshiBarbadianBasqueBelgianBelizeanBermudanBhutaneseBlackfeetBolivianBrazilianBritishBritish West IndianBulgarianBurmeseCajunCambodianCanadianCape VerdeanCarpatho RusynCelticCentral AmericanCentral American IndianCherokeeCheyenneChickasawChileanChineseChippewaChoctawColombianColvilleComancheCosta RicanCreeCreekCroatianCrowCubanCypriotCzechCzechoslovakianDanishDelawareDominicanDutchDutch West IndianEastern EuropeanEcuadorianEgyptianEnglishEstonianEthiopianEuropeanFijianFilipinoFinnishFrenchFrench American IndianFrench CanadianGermanGerman RussianGhanaianGreekGuamanian/ChamorroGuatemalanGuyaneseHaitianHmongHonduranHopiHoumaHungarianIcelanderIndian (Asian)IndonesianInupiatIranianIraqiIrishIroquoisIsraeliJamaicanJapaneseJordanianKenyanKiowaKoreanLaotianLatvianLebaneseLiberianLithuanianLumbeeLuxembourgerMacedonianMalaysianMalteseMarshalleseMenomineeMexicanMexican American IndianMongolianMoroccanNative HawaiianNavajoNepaleseNew ZealanderNicaraguanNigerianNorthern EuropeanNorwegianOkinawanOsageOttawaPaiutePakistaniPalestinianPanamanianParaguayanPennsylvania GermanPeruvianPimaPolishPortuguesePotawatomiPuebloPuerto RicanPuget Sound SalishRomanianRussianSalvadoranSamoanScandinavianScotch-IrishScottishSeminoleSenegaleseSerbianShoshoneSierra LeoneanSiouxSlavicSlovakSloveneSomaliSouth AfricanSouth AmericanSouth American IndianSoviet UnionSpaniardSpanishSpanish AmericanSpanish American IndianSri LankanSubsaharan AfricanSudaneseSwedishSwissSyrianTaiwaneseThaiTlingit-HaidaTohono O'OdhamTonganTrinidadian and TobagonianTsimshianTurkishU.S. Virgin IslanderUgandanUkrainianUruguayanUteVenezuelanVietnameseWelshWest IndianYakamaYaquiYugoslavianYumanYup'ikZimbabwean
Immigration
NonimmigrantsImmigrantsAfghanistanAfricaAlbaniaArgentinaArmeniaAsiaAustraliaAustriaBahamasBangladeshBarbadosBelarusBelgiumBelizeBoliviaBosnia and HerzegovinaBrazilBulgariaBurma/MyanmarCabo VerdeCambodiaCameroonCanadaCaribbeanCentral AmericaChileChinaColombiaCongoCosta RicaCroatiaCubaCzechoslovakiaDenmarkDominicaDominican RepublicEastern AfricaEastern AsiaEastern EuropeEcuadorEgyptEl SalvadorEnglandEritreaEthiopiaEuropeFijiFranceGermanyGhanaGreeceGrenadaGuatemalaGuyanaHaitiHondurasHong KongHungaryIndiaIndonesiaIranIraqIrelandIsraelItalyJamaicaJapanJordanKazakhstanKenyaKoreaKuwaitLaosLatin AmericaLatviaLebanonLiberiaLithuaniaMalaysiaMexicoMicronesiaMiddle AfricaMoldovaMoroccoNepalNetherlandsNicaraguaNigeriaNorth AmericaNorth MacedoniaNorthern AfricaNorthern EuropeNorwayOceaniaPakistanPanamaPeruPhilippinesPolandPortugalRomaniaRussiaSaudi ArabiaScotlandSenegalSerbiaSierra LeoneSingaporeSomaliaSouth AfricaSouth AmericaSouth Central AsiaSouth Eastern AsiaSouthern EuropeSpainSri LankaSt. Vincent and the GrenadinesSudanSwedenSwitzerlandSyriaTaiwanThailandTrinidad and TobagoTurkeyUgandaUkraineUruguayUzbekistanVenezuelaVietnamWest IndiesWestern AfricaWestern AsiaWestern EuropeYemenZaireZimbabweAzores
Italian
Race
Ancestry
AfghanAfricanAlaska NativeAlaskan AthabascanAlbanianAleutAlsatianAmericanApacheArabArapahoArgentineanArmenianAssyrian/Chaldean/SyriacAustralianAustrianBahamianBangladeshiBarbadianBasqueBelgianBelizeanBermudanBhutaneseBlackfeetBolivianBrazilianBritishBritish West IndianBulgarianBurmeseCajunCambodianCanadianCape VerdeanCarpatho RusynCelticCentral AmericanCentral American IndianCherokeeCheyenneChickasawChileanChineseChippewaChoctawColombianColvilleComancheCosta RicanCreeCreekCroatianCrowCubanCypriotCzechCzechoslovakianDanishDelawareDominicanDutchDutch West IndianEastern EuropeanEcuadorianEgyptianEnglishEstonianEthiopianEuropeanFijianFilipinoFinnishFrenchFrench American IndianFrench CanadianGermanGerman RussianGhanaianGreekGuamanian/ChamorroGuatemalanGuyaneseHaitianHmongHonduranHopiHoumaHungarianIcelanderIndian (Asian)IndonesianInupiatIranianIraqiIrishIroquoisIsraeliItalianJamaicanJapaneseJordanianKenyanKiowaKoreanLaotianLatvianLebaneseLiberianLithuanianLumbeeLuxembourgerMacedonianMalaysianMalteseMarshalleseMenomineeMexicanMexican American IndianMongolianMoroccanNative HawaiianNavajoNepaleseNew ZealanderNigerianNorthern EuropeanNorwegianOkinawanOsageOttawaPaiutePakistaniPalestinianPanamanianParaguayanPennsylvania GermanPeruvianPimaPolishPortuguesePotawatomiPuebloPuerto RicanPuget Sound SalishRomanianRussianSalvadoranSamoanScandinavianScotch-IrishScottishSeminoleSenegaleseSerbianShoshoneSierra LeoneanSiouxSlavicSlovakSloveneSomaliSouth AfricanSouth AmericanSouth American IndianSoviet UnionSpaniardSpanishSpanish AmericanSpanish American IndianSri LankanSubsaharan AfricanSudaneseSwedishSwissSyrianTaiwaneseThaiTlingit-HaidaTohono O'OdhamTonganTrinidadian and TobagonianTsimshianTurkishU.S. Virgin IslanderUgandanUkrainianUruguayanUteVenezuelanVietnameseWelshWest IndianYakamaYaquiYugoslavianYumanYup'ikZimbabwean
Immigration
NonimmigrantsImmigrantsAfghanistanAfricaAlbaniaArgentinaArmeniaAsiaAustraliaAustriaBahamasBangladeshBarbadosBelarusBelgiumBelizeBoliviaBosnia and HerzegovinaBrazilBulgariaBurma/MyanmarCabo VerdeCambodiaCameroonCanadaCaribbeanCentral AmericaChileChinaColombiaCongoCosta RicaCroatiaCubaCzechoslovakiaDenmarkDominicaDominican RepublicEastern AfricaEastern AsiaEastern EuropeEcuadorEgyptEl SalvadorEnglandEritreaEthiopiaEuropeFijiFranceGermanyGhanaGreeceGrenadaGuatemalaGuyanaHaitiHondurasHong KongHungaryIndiaIndonesiaIranIraqIrelandIsraelItalyJamaicaJapanJordanKazakhstanKenyaKoreaKuwaitLaosLatin AmericaLatviaLebanonLiberiaLithuaniaMalaysiaMexicoMicronesiaMiddle AfricaMoldovaMoroccoNepalNetherlandsNicaraguaNigeriaNorth AmericaNorth MacedoniaNorthern AfricaNorthern EuropeNorwayOceaniaPakistanPanamaPeruPhilippinesPolandPortugalRomaniaRussiaSaudi ArabiaScotlandSenegalSerbiaSierra LeoneSingaporeSomaliaSouth AfricaSouth AmericaSouth Central AsiaSouth Eastern AsiaSouthern EuropeSpainSri LankaSt. Vincent and the GrenadinesSudanSwedenSwitzerlandSyriaTaiwanThailandTrinidad and TobagoTurkeyUgandaUkraineUruguayUzbekistanVenezuelaVietnamWest IndiesWestern AfricaWestern AsiaWestern EuropeYemenZaireZimbabweAzores
Female Poverty Among 25-34 Year Olds
Income
Poverty
Unemployment
Labor Participation
Family Structure
Vehicle Availability
Education Level
Disability

Female Poverty Among 25-34 Year Olds Comparison

Nicaraguans

Italians

Tragic
Exceptional
14.5%
FEMALE POVERTY AMONG 25-34 YEAR OLDS
3.3/ 100
METRIC RATING
226th/ 347
METRIC RANK
12.5%
FEMALE POVERTY AMONG 25-34 YEAR OLDS
97.2/ 100
METRIC RATING
89th/ 347
METRIC RANK

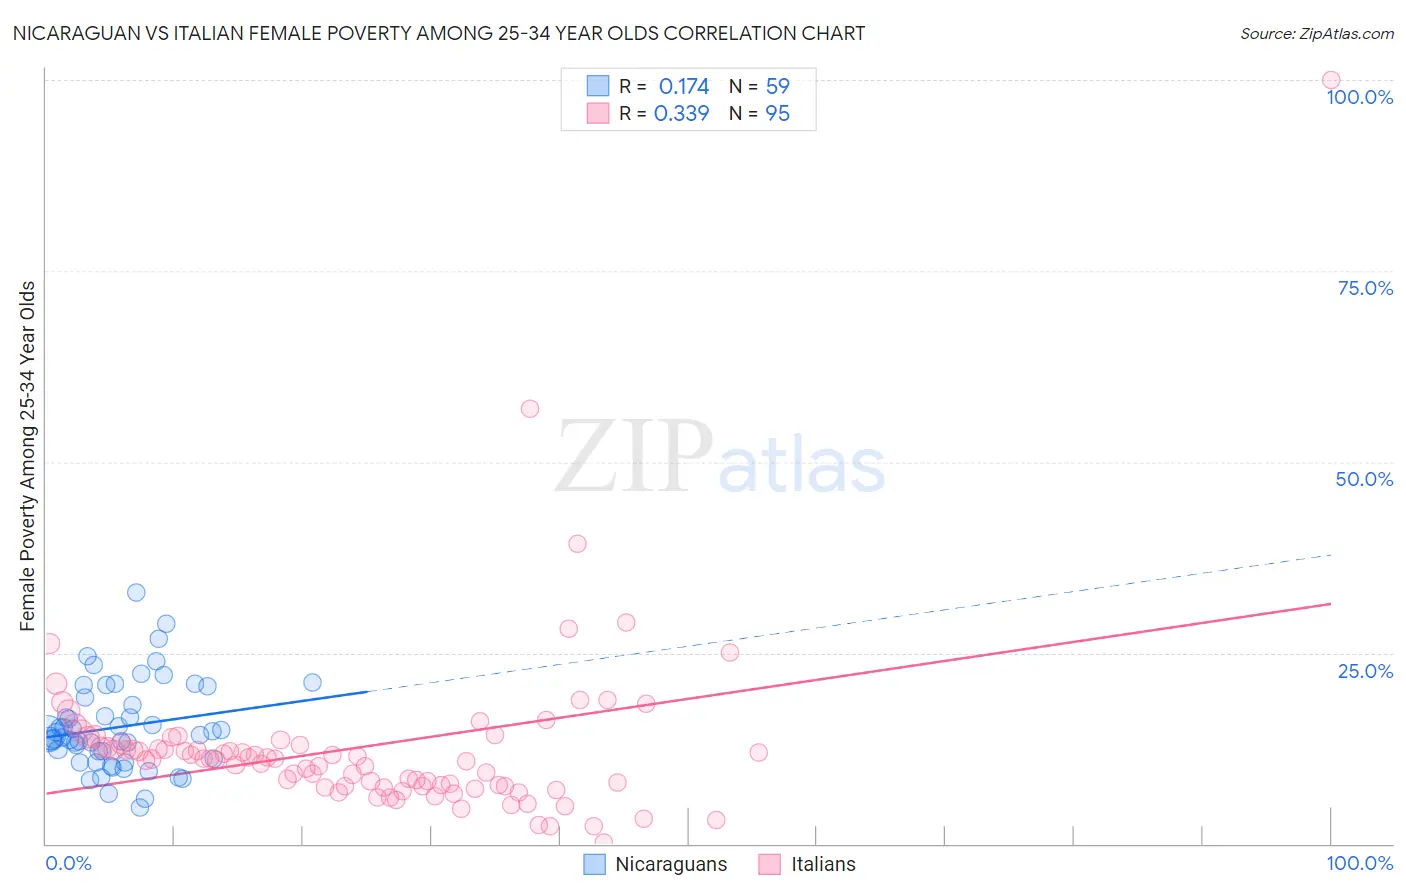
Nicaraguan vs Italian Female Poverty Among 25-34 Year Olds Correlation Chart

The statistical analysis conducted on geographies consisting of 283,781,399 people shows a poor positive correlation between the proportion of Nicaraguans and poverty level among females between the ages 25 and 34 in the United States with a correlation coefficient (R) of 0.174 and weighted average of 14.5%. Similarly, the statistical analysis conducted on geographies consisting of 551,961,209 people shows a mild positive correlation between the proportion of Italians and poverty level among females between the ages 25 and 34 in the United States with a correlation coefficient (R) of 0.339 and weighted average of 12.5%, a difference of 15.6%.
Nicaraguan vs Italian Female Poverty Among 25-34 Year Olds

Female Poverty Among 25-34 Year Olds Correlation Summary

MeasurementNicaraguanItalian
Minimum4.7%0.18%
Maximum32.8%100.0%
Range28.1%99.8%
Mean15.3%12.7%
Median14.3%11.1%
Interquartile 25% (IQ1)11.1%7.5%
Interquartile 75% (IQ3)19.2%13.1%
Interquartile Range (IQR)8.1%5.5%
Standard Deviation (Sample)5.7%11.8%
Standard Deviation (Population)5.7%11.8%

Similar Demographics by Female Poverty Among 25-34 Year Olds

Demographics Similar to Nicaraguans by Female Poverty Among 25-34 Year Olds

In terms of female poverty among 25-34 year olds, the demographic groups most similar to Nicaraguans are Immigrants from Barbados (14.5%, a difference of 0.080%), Celtic (14.5%, a difference of 0.30%), Immigrants from Sudan (14.4%, a difference of 0.40%), Nigerian (14.4%, a difference of 0.47%), and Vietnamese (14.6%, a difference of 0.47%).
DemographicsRating | RankFemale Poverty Among 25-34 Year Olds
Ecuadorians
5.2
/100
|
#219
Tragic
14.3%
Ghanaians
4.8
/100
|
#220
Tragic
14.4%
Sudanese
4.4
/100
|
#221
Tragic
14.4%
Immigrants | Portugal
4.3
/100
|
#222
Tragic
14.4%
Nigerians
4.2
/100
|
#223
Tragic
14.4%
Immigrants | Sudan
4.0
/100
|
#224
Tragic
14.4%
Immigrants | Barbados
3.4
/100
|
#225
Tragic
14.5%
Nicaraguans
3.3
/100
|
#226
Tragic
14.5%
Celtics
2.8
/100
|
#227
Tragic
14.5%
Vietnamese
2.6
/100
|
#228
Tragic
14.6%
Spanish
2.5
/100
|
#229
Tragic
14.6%
Spaniards
2.3
/100
|
#230
Tragic
14.6%
Delaware
2.3
/100
|
#231
Tragic
14.6%
Immigrants | Ecuador
1.9
/100
|
#232
Tragic
14.6%
Whites/Caucasians
1.8
/100
|
#233
Tragic
14.7%

Demographics Similar to Italians by Female Poverty Among 25-34 Year Olds

In terms of female poverty among 25-34 year olds, the demographic groups most similar to Italians are Immigrants from Albania (12.5%, a difference of 0.15%), Immigrants from Austria (12.5%, a difference of 0.17%), Argentinean (12.5%, a difference of 0.24%), Norwegian (12.6%, a difference of 0.25%), and Croatian (12.5%, a difference of 0.27%).
DemographicsRating | RankFemale Poverty Among 25-34 Year Olds
Ethiopians
98.0
/100
|
#82
Exceptional
12.4%
Albanians
97.7
/100
|
#83
Exceptional
12.5%
Immigrants | Latvia
97.7
/100
|
#84
Exceptional
12.5%
Immigrants | South Eastern Asia
97.6
/100
|
#85
Exceptional
12.5%
Croatians
97.5
/100
|
#86
Exceptional
12.5%
Argentineans
97.5
/100
|
#87
Exceptional
12.5%
Immigrants | Austria
97.4
/100
|
#88
Exceptional
12.5%
Italians
97.2
/100
|
#89
Exceptional
12.5%
Immigrants | Albania
97.1
/100
|
#90
Exceptional
12.5%
Norwegians
96.9
/100
|
#91
Exceptional
12.6%
Immigrants | Armenia
96.9
/100
|
#92
Exceptional
12.6%
Palestinians
96.9
/100
|
#93
Exceptional
12.6%
Immigrants | France
96.8
/100
|
#94
Exceptional
12.6%
Ukrainians
96.7
/100
|
#95
Exceptional
12.6%
Immigrants | Zimbabwe
96.7
/100
|
#96
Exceptional
12.6%