Nicaraguan vs Finnish Median Male Earnings
COMPARE
Nicaraguan
Finnish
Median Male Earnings
Median Male Earnings Comparison
Nicaraguans
Finns
$49,215
MEDIAN MALE EARNINGS
0.6/ 100
METRIC RATING
263rd/ 347
METRIC RANK
$54,721
MEDIAN MALE EARNINGS
55.6/ 100
METRIC RATING
170th/ 347
METRIC RANK
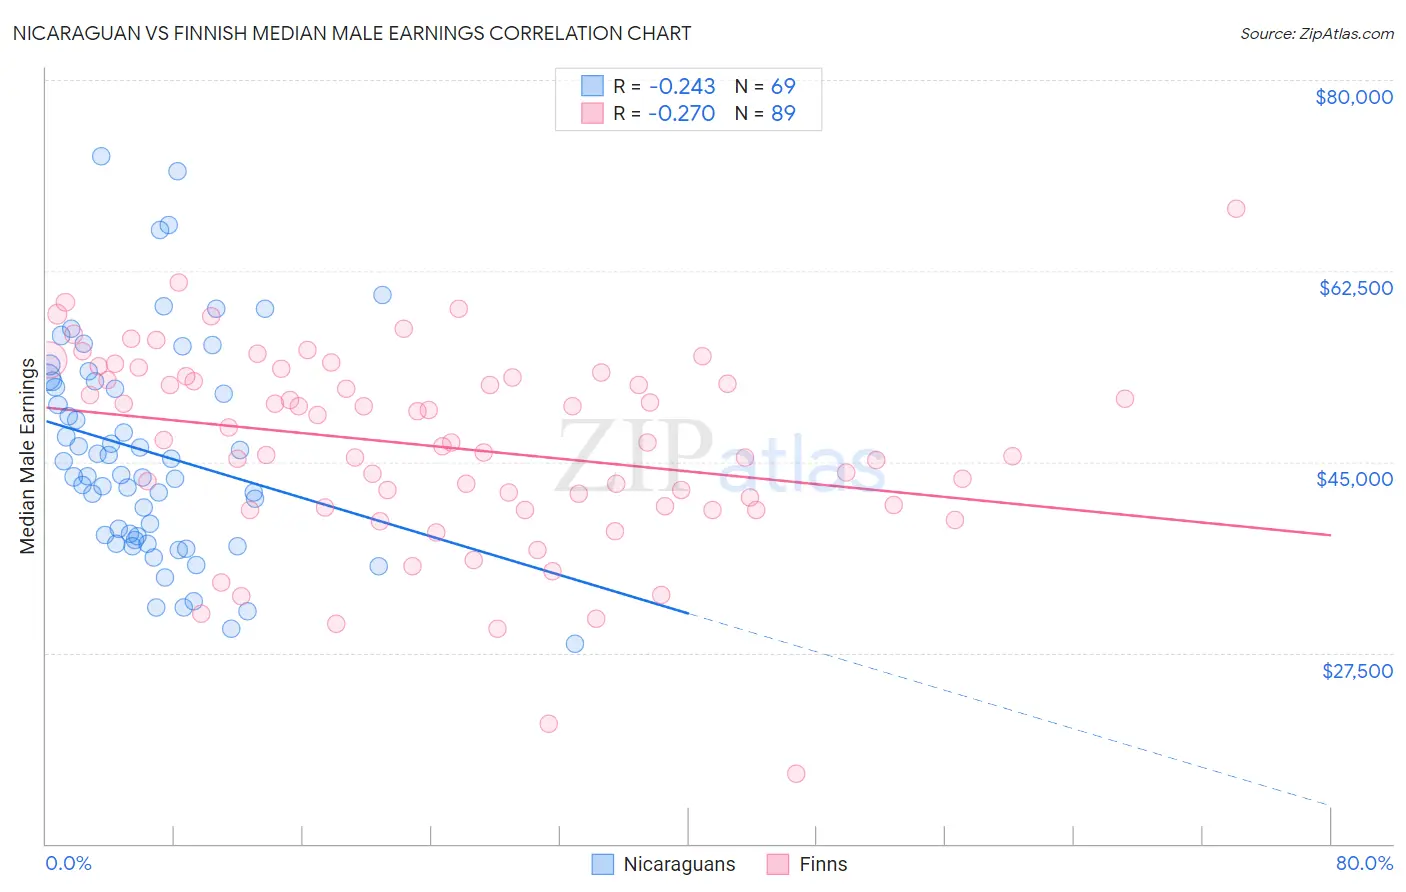
Nicaraguan vs Finnish Median Male Earnings Correlation Chart
The statistical analysis conducted on geographies consisting of 285,681,688 people shows a weak negative correlation between the proportion of Nicaraguans and median male earnings in the United States with a correlation coefficient (R) of -0.243 and weighted average of $49,215. Similarly, the statistical analysis conducted on geographies consisting of 404,473,332 people shows a weak negative correlation between the proportion of Finns and median male earnings in the United States with a correlation coefficient (R) of -0.270 and weighted average of $54,721, a difference of 11.2%.
Median Male Earnings Correlation Summary
| Measurement | Nicaraguan | Finnish |
| Minimum | $28,353 | $16,413 |
| Maximum | $73,045 | $68,250 |
| Range | $44,692 | $51,837 |
| Mean | $45,837 | $46,398 |
| Median | $43,824 | $46,792 |
| Interquartile 25% (IQ1) | $37,970 | $40,892 |
| Interquartile 75% (IQ3) | $52,426 | $52,786 |
| Interquartile Range (IQR) | $14,456 | $11,894 |
| Standard Deviation (Sample) | $9,879 | $8,951 |
| Standard Deviation (Population) | $9,808 | $8,900 |
Similar Demographics by Median Male Earnings
Demographics Similar to Nicaraguans by Median Male Earnings
In terms of median male earnings, the demographic groups most similar to Nicaraguans are Immigrants from Middle Africa ($49,201, a difference of 0.030%), Immigrants from Laos ($49,190, a difference of 0.050%), Immigrants from West Indies ($49,271, a difference of 0.11%), Liberian ($49,318, a difference of 0.21%), and Iroquois ($49,374, a difference of 0.32%).
| Demographics | Rating | Rank | Median Male Earnings |
| Alaska Natives | 0.9 /100 | #256 | Tragic $49,711 |
| British West Indians | 0.8 /100 | #257 | Tragic $49,636 |
| Cree | 0.7 /100 | #258 | Tragic $49,497 |
| Nepalese | 0.7 /100 | #259 | Tragic $49,458 |
| Iroquois | 0.7 /100 | #260 | Tragic $49,374 |
| Liberians | 0.6 /100 | #261 | Tragic $49,318 |
| Immigrants | West Indies | 0.6 /100 | #262 | Tragic $49,271 |
| Nicaraguans | 0.6 /100 | #263 | Tragic $49,215 |
| Immigrants | Middle Africa | 0.6 /100 | #264 | Tragic $49,201 |
| Immigrants | Laos | 0.6 /100 | #265 | Tragic $49,190 |
| Somalis | 0.5 /100 | #266 | Tragic $49,025 |
| Spanish Americans | 0.5 /100 | #267 | Tragic $49,008 |
| Ute | 0.4 /100 | #268 | Tragic $48,899 |
| Tsimshian | 0.4 /100 | #269 | Tragic $48,836 |
| Potawatomi | 0.4 /100 | #270 | Tragic $48,768 |
Demographics Similar to Finns by Median Male Earnings
In terms of median male earnings, the demographic groups most similar to Finns are French Canadian ($54,722, a difference of 0.0%), Immigrants from Peru ($54,695, a difference of 0.050%), Welsh ($54,647, a difference of 0.14%), Immigrants from Vietnam ($54,913, a difference of 0.35%), and South American Indian ($54,508, a difference of 0.39%).
| Demographics | Rating | Rank | Median Male Earnings |
| Ugandans | 68.6 /100 | #163 | Good $55,290 |
| Immigrants | South Eastern Asia | 67.6 /100 | #164 | Good $55,241 |
| Immigrants | Portugal | 66.3 /100 | #165 | Good $55,182 |
| Germans | 61.6 /100 | #166 | Good $54,974 |
| Immigrants | Fiji | 61.2 /100 | #167 | Good $54,958 |
| Immigrants | Vietnam | 60.2 /100 | #168 | Good $54,913 |
| French Canadians | 55.6 /100 | #169 | Average $54,722 |
| Finns | 55.6 /100 | #170 | Average $54,721 |
| Immigrants | Peru | 54.9 /100 | #171 | Average $54,695 |
| Welsh | 53.8 /100 | #172 | Average $54,647 |
| South American Indians | 50.4 /100 | #173 | Average $54,508 |
| South Americans | 50.0 /100 | #174 | Average $54,492 |
| Dutch | 48.0 /100 | #175 | Average $54,410 |
| Spaniards | 47.8 /100 | #176 | Average $54,401 |
| Costa Ricans | 44.8 /100 | #177 | Average $54,279 |