Nicaraguan vs Marshallese Median Male Earnings
COMPARE
Nicaraguan
Marshallese
Median Male Earnings
Median Male Earnings Comparison
Nicaraguans
Marshallese
$49,215
MEDIAN MALE EARNINGS
0.6/ 100
METRIC RATING
263rd/ 347
METRIC RANK
$48,137
MEDIAN MALE EARNINGS
0.2/ 100
METRIC RATING
281st/ 347
METRIC RANK
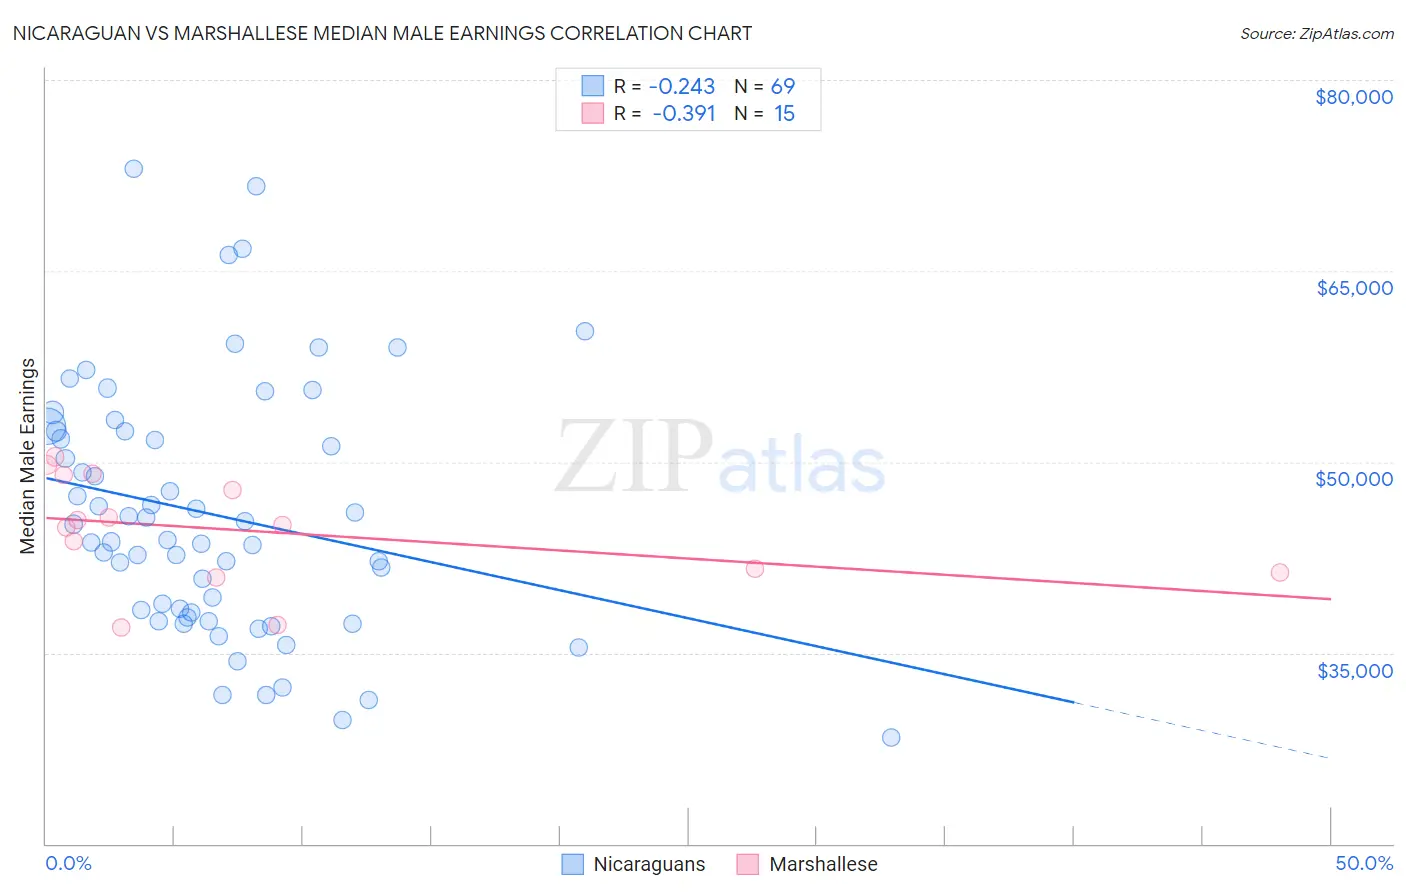
Nicaraguan vs Marshallese Median Male Earnings Correlation Chart
The statistical analysis conducted on geographies consisting of 285,681,688 people shows a weak negative correlation between the proportion of Nicaraguans and median male earnings in the United States with a correlation coefficient (R) of -0.243 and weighted average of $49,215. Similarly, the statistical analysis conducted on geographies consisting of 14,760,790 people shows a mild negative correlation between the proportion of Marshallese and median male earnings in the United States with a correlation coefficient (R) of -0.391 and weighted average of $48,137, a difference of 2.2%.
Median Male Earnings Correlation Summary
| Measurement | Nicaraguan | Marshallese |
| Minimum | $28,353 | $37,012 |
| Maximum | $73,045 | $50,395 |
| Range | $44,692 | $13,383 |
| Mean | $45,837 | $44,583 |
| Median | $43,824 | $45,000 |
| Interquartile 25% (IQ1) | $37,970 | $41,333 |
| Interquartile 75% (IQ3) | $52,426 | $48,969 |
| Interquartile Range (IQR) | $14,456 | $7,636 |
| Standard Deviation (Sample) | $9,879 | $4,286 |
| Standard Deviation (Population) | $9,808 | $4,141 |
Demographics Similar to Nicaraguans and Marshallese by Median Male Earnings
In terms of median male earnings, the demographic groups most similar to Nicaraguans are Immigrants from Middle Africa ($49,201, a difference of 0.030%), Immigrants from Laos ($49,190, a difference of 0.050%), Immigrants from West Indies ($49,271, a difference of 0.11%), Somali ($49,025, a difference of 0.39%), and Spanish American ($49,008, a difference of 0.42%). Similarly, the demographic groups most similar to Marshallese are Central American ($48,093, a difference of 0.090%), Comanche ($48,202, a difference of 0.13%), Hmong ($48,254, a difference of 0.24%), Immigrants from Liberia ($48,317, a difference of 0.37%), and Belizean ($48,358, a difference of 0.46%).
| Demographics | Rating | Rank | Median Male Earnings |
| Immigrants | West Indies | 0.6 /100 | #262 | Tragic $49,271 |
| Nicaraguans | 0.6 /100 | #263 | Tragic $49,215 |
| Immigrants | Middle Africa | 0.6 /100 | #264 | Tragic $49,201 |
| Immigrants | Laos | 0.6 /100 | #265 | Tragic $49,190 |
| Somalis | 0.5 /100 | #266 | Tragic $49,025 |
| Spanish Americans | 0.5 /100 | #267 | Tragic $49,008 |
| Ute | 0.4 /100 | #268 | Tragic $48,899 |
| Tsimshian | 0.4 /100 | #269 | Tragic $48,836 |
| Potawatomi | 0.4 /100 | #270 | Tragic $48,768 |
| Cherokee | 0.3 /100 | #271 | Tragic $48,669 |
| Salvadorans | 0.3 /100 | #272 | Tragic $48,646 |
| Jamaicans | 0.3 /100 | #273 | Tragic $48,632 |
| Colville | 0.3 /100 | #274 | Tragic $48,516 |
| Immigrants | Somalia | 0.3 /100 | #275 | Tragic $48,439 |
| Blackfeet | 0.3 /100 | #276 | Tragic $48,402 |
| Belizeans | 0.2 /100 | #277 | Tragic $48,358 |
| Immigrants | Liberia | 0.2 /100 | #278 | Tragic $48,317 |
| Hmong | 0.2 /100 | #279 | Tragic $48,254 |
| Comanche | 0.2 /100 | #280 | Tragic $48,202 |
| Marshallese | 0.2 /100 | #281 | Tragic $48,137 |
| Central Americans | 0.2 /100 | #282 | Tragic $48,093 |