Nicaraguan vs Italian Unemployment Among Ages 60 to 64 years
COMPARE
Nicaraguan
Italian
Unemployment Among Ages 60 to 64 years
Unemployment Among Ages 60 to 64 years Comparison
Nicaraguans
Italians
4.9%
UNEMPLOYMENT AMONG AGES 60 TO 64 YEARS
30.4/ 100
METRIC RATING
188th/ 347
METRIC RANK
4.8%
UNEMPLOYMENT AMONG AGES 60 TO 64 YEARS
85.0/ 100
METRIC RATING
143rd/ 347
METRIC RANK
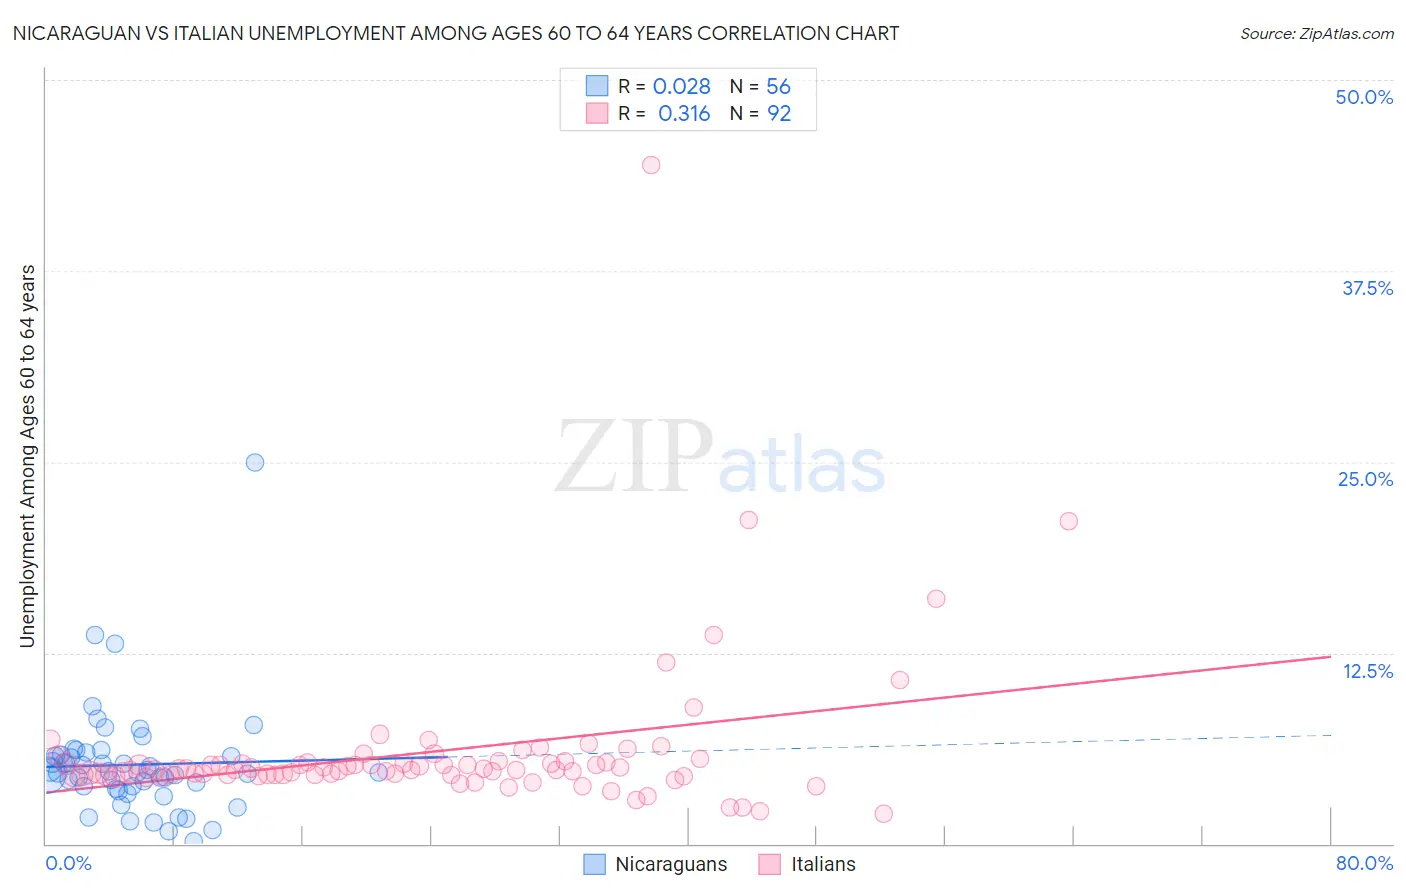
Nicaraguan vs Italian Unemployment Among Ages 60 to 64 years Correlation Chart
The statistical analysis conducted on geographies consisting of 268,869,050 people shows no correlation between the proportion of Nicaraguans and unemployment rate among population between the ages 60 and 64 in the United States with a correlation coefficient (R) of 0.028 and weighted average of 4.9%. Similarly, the statistical analysis conducted on geographies consisting of 467,885,151 people shows a mild positive correlation between the proportion of Italians and unemployment rate among population between the ages 60 and 64 in the United States with a correlation coefficient (R) of 0.316 and weighted average of 4.8%, a difference of 2.3%.
Unemployment Among Ages 60 to 64 years Correlation Summary
| Measurement | Nicaraguan | Italian |
| Minimum | 0.20% | 2.0% |
| Maximum | 25.0% | 44.4% |
| Range | 24.8% | 42.4% |
| Mean | 5.2% | 6.0% |
| Median | 4.7% | 4.8% |
| Interquartile 25% (IQ1) | 3.7% | 4.5% |
| Interquartile 75% (IQ3) | 5.8% | 5.3% |
| Interquartile Range (IQR) | 2.1% | 0.80% |
| Standard Deviation (Sample) | 3.7% | 5.1% |
| Standard Deviation (Population) | 3.6% | 5.1% |
Similar Demographics by Unemployment Among Ages 60 to 64 years
Demographics Similar to Nicaraguans by Unemployment Among Ages 60 to 64 years
In terms of unemployment among ages 60 to 64 years, the demographic groups most similar to Nicaraguans are Immigrants from Nicaragua (4.9%, a difference of 0.020%), Immigrants from Europe (4.9%, a difference of 0.020%), South American Indian (4.9%, a difference of 0.030%), Immigrants from Nigeria (4.9%, a difference of 0.030%), and Menominee (4.9%, a difference of 0.060%).
| Demographics | Rating | Rank | Unemployment Among Ages 60 to 64 years |
| Hungarians | 40.6 /100 | #181 | Average 4.9% |
| Sri Lankans | 39.8 /100 | #182 | Fair 4.9% |
| Sub-Saharan Africans | 38.9 /100 | #183 | Fair 4.9% |
| Immigrants | Ukraine | 37.6 /100 | #184 | Fair 4.9% |
| Ute | 37.4 /100 | #185 | Fair 4.9% |
| Spaniards | 35.8 /100 | #186 | Fair 4.9% |
| South American Indians | 31.2 /100 | #187 | Fair 4.9% |
| Nicaraguans | 30.4 /100 | #188 | Fair 4.9% |
| Immigrants | Nicaragua | 29.8 /100 | #189 | Fair 4.9% |
| Immigrants | Europe | 29.8 /100 | #190 | Fair 4.9% |
| Immigrants | Nigeria | 29.6 /100 | #191 | Fair 4.9% |
| Menominee | 28.8 /100 | #192 | Fair 4.9% |
| Houma | 28.3 /100 | #193 | Fair 4.9% |
| Immigrants | Colombia | 26.8 /100 | #194 | Fair 4.9% |
| Immigrants | Austria | 26.6 /100 | #195 | Fair 4.9% |
Demographics Similar to Italians by Unemployment Among Ages 60 to 64 years
In terms of unemployment among ages 60 to 64 years, the demographic groups most similar to Italians are Immigrants from Ethiopia (4.8%, a difference of 0.020%), Panamanian (4.8%, a difference of 0.030%), Pima (4.8%, a difference of 0.060%), Immigrants from Pakistan (4.8%, a difference of 0.11%), and Immigrants from Lithuania (4.8%, a difference of 0.12%).
| Demographics | Rating | Rank | Unemployment Among Ages 60 to 64 years |
| French Canadians | 87.6 /100 | #136 | Excellent 4.8% |
| Cambodians | 86.9 /100 | #137 | Excellent 4.8% |
| Immigrants | Lithuania | 86.7 /100 | #138 | Excellent 4.8% |
| Immigrants | Africa | 86.6 /100 | #139 | Excellent 4.8% |
| Pima | 85.8 /100 | #140 | Excellent 4.8% |
| Panamanians | 85.5 /100 | #141 | Excellent 4.8% |
| Immigrants | Ethiopia | 85.3 /100 | #142 | Excellent 4.8% |
| Italians | 85.0 /100 | #143 | Excellent 4.8% |
| Immigrants | Pakistan | 83.3 /100 | #144 | Excellent 4.8% |
| Burmese | 83.1 /100 | #145 | Excellent 4.8% |
| Turks | 81.9 /100 | #146 | Excellent 4.8% |
| Mongolians | 81.2 /100 | #147 | Excellent 4.8% |
| Latvians | 79.1 /100 | #148 | Good 4.8% |
| Arabs | 78.8 /100 | #149 | Good 4.8% |
| Immigrants | Italy | 78.7 /100 | #150 | Good 4.8% |