Nicaraguan vs Ottawa Householder Income Ages 45 - 64 years
COMPARE
Nicaraguan
Ottawa
Householder Income Ages 45 - 64 years
Householder Income Ages 45 - 64 years Comparison
Nicaraguans
Ottawa
$92,554
HOUSEHOLDER INCOME AGES 45 - 64 YEARS
2.0/ 100
METRIC RATING
235th/ 347
METRIC RANK
$83,953
HOUSEHOLDER INCOME AGES 45 - 64 YEARS
0.0/ 100
METRIC RATING
304th/ 347
METRIC RANK
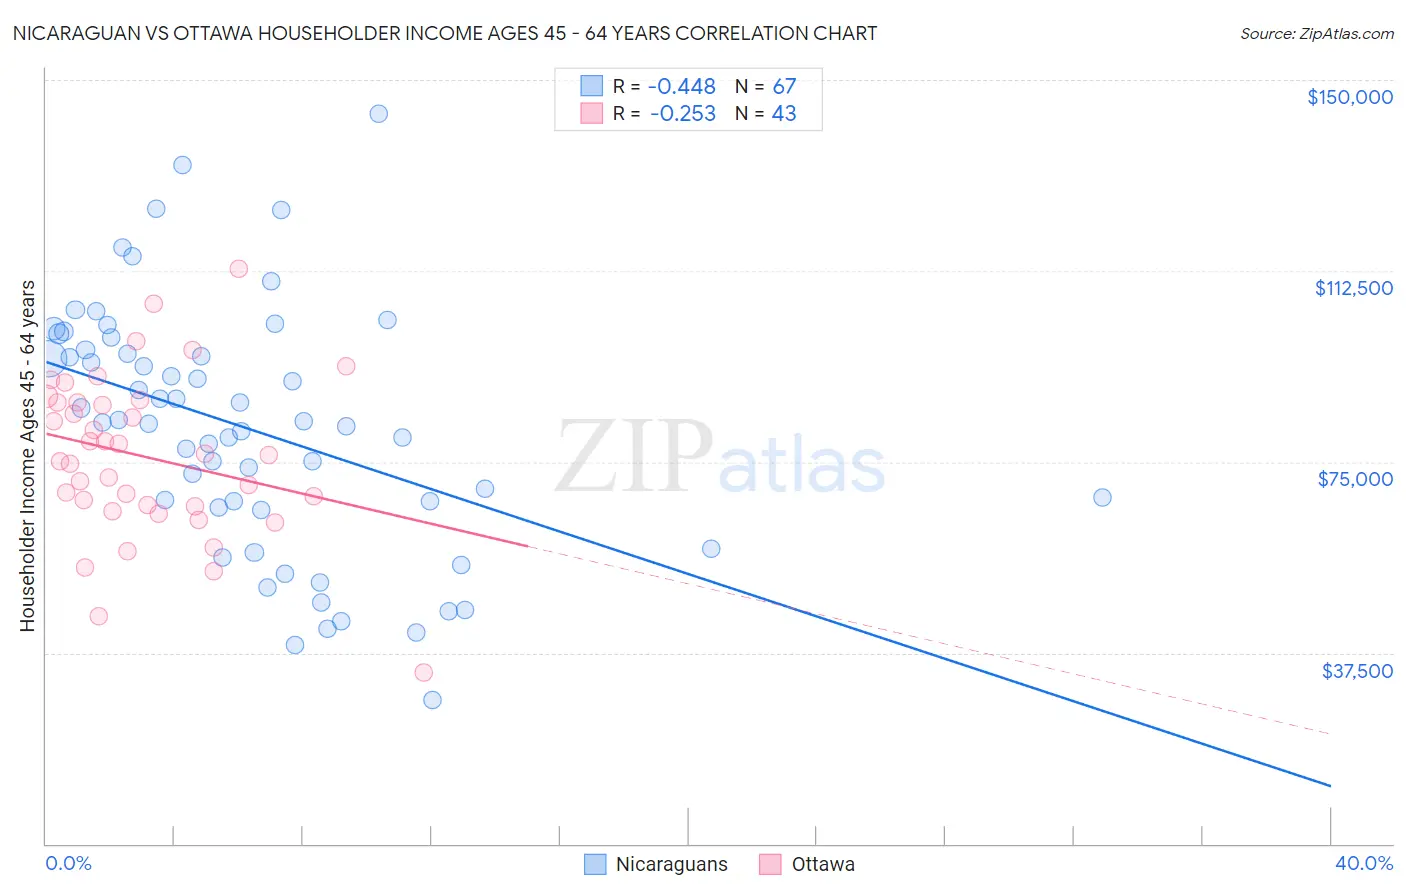
Nicaraguan vs Ottawa Householder Income Ages 45 - 64 years Correlation Chart
The statistical analysis conducted on geographies consisting of 285,455,772 people shows a moderate negative correlation between the proportion of Nicaraguans and household income with householder between the ages 45 and 64 in the United States with a correlation coefficient (R) of -0.448 and weighted average of $92,554. Similarly, the statistical analysis conducted on geographies consisting of 49,895,543 people shows a weak negative correlation between the proportion of Ottawa and household income with householder between the ages 45 and 64 in the United States with a correlation coefficient (R) of -0.253 and weighted average of $83,953, a difference of 10.2%.
Householder Income Ages 45 - 64 years Correlation Summary
| Measurement | Nicaraguan | Ottawa |
| Minimum | $28,333 | $33,750 |
| Maximum | $143,278 | $112,917 |
| Range | $114,945 | $79,167 |
| Mean | $81,452 | $75,969 |
| Median | $82,750 | $76,250 |
| Interquartile 25% (IQ1) | $65,957 | $66,250 |
| Interquartile 75% (IQ3) | $97,029 | $86,776 |
| Interquartile Range (IQR) | $31,072 | $20,526 |
| Standard Deviation (Sample) | $24,263 | $15,805 |
| Standard Deviation (Population) | $24,082 | $15,620 |
Similar Demographics by Householder Income Ages 45 - 64 years
Demographics Similar to Nicaraguans by Householder Income Ages 45 - 64 years
In terms of householder income ages 45 - 64 years, the demographic groups most similar to Nicaraguans are Immigrants from Western Africa ($92,384, a difference of 0.18%), Immigrants from Bangladesh ($92,208, a difference of 0.37%), Pennsylvania German ($91,956, a difference of 0.65%), Immigrants from El Salvador ($93,176, a difference of 0.67%), and Nepalese ($93,355, a difference of 0.87%).
| Demographics | Rating | Rank | Householder Income Ages 45 - 64 years |
| Immigrants | Panama | 3.7 /100 | #228 | Tragic $93,815 |
| Vietnamese | 3.6 /100 | #229 | Tragic $93,788 |
| Immigrants | Sudan | 3.6 /100 | #230 | Tragic $93,781 |
| Ecuadorians | 3.6 /100 | #231 | Tragic $93,739 |
| Sudanese | 3.5 /100 | #232 | Tragic $93,718 |
| Nepalese | 3.0 /100 | #233 | Tragic $93,355 |
| Immigrants | El Salvador | 2.7 /100 | #234 | Tragic $93,176 |
| Nicaraguans | 2.0 /100 | #235 | Tragic $92,554 |
| Immigrants | Western Africa | 1.8 /100 | #236 | Tragic $92,384 |
| Immigrants | Bangladesh | 1.7 /100 | #237 | Tragic $92,208 |
| Pennsylvania Germans | 1.5 /100 | #238 | Tragic $91,956 |
| Immigrants | Ecuador | 1.2 /100 | #239 | Tragic $91,462 |
| Immigrants | Burma/Myanmar | 1.1 /100 | #240 | Tragic $91,385 |
| Trinidadians and Tobagonians | 1.1 /100 | #241 | Tragic $91,357 |
| Inupiat | 1.1 /100 | #242 | Tragic $91,355 |
Demographics Similar to Ottawa by Householder Income Ages 45 - 64 years
In terms of householder income ages 45 - 64 years, the demographic groups most similar to Ottawa are Chippewa ($83,943, a difference of 0.010%), Ute ($83,937, a difference of 0.020%), Honduran ($84,079, a difference of 0.15%), Shoshone ($83,588, a difference of 0.44%), and Immigrants from Cabo Verde ($83,542, a difference of 0.49%).
| Demographics | Rating | Rank | Householder Income Ages 45 - 64 years |
| Fijians | 0.1 /100 | #297 | Tragic $85,187 |
| Africans | 0.0 /100 | #298 | Tragic $84,925 |
| Immigrants | Mexico | 0.0 /100 | #299 | Tragic $84,910 |
| Indonesians | 0.0 /100 | #300 | Tragic $84,890 |
| Potawatomi | 0.0 /100 | #301 | Tragic $84,613 |
| Haitians | 0.0 /100 | #302 | Tragic $84,384 |
| Hondurans | 0.0 /100 | #303 | Tragic $84,079 |
| Ottawa | 0.0 /100 | #304 | Tragic $83,953 |
| Chippewa | 0.0 /100 | #305 | Tragic $83,943 |
| Ute | 0.0 /100 | #306 | Tragic $83,937 |
| Shoshone | 0.0 /100 | #307 | Tragic $83,588 |
| Immigrants | Cabo Verde | 0.0 /100 | #308 | Tragic $83,542 |
| Immigrants | Dominica | 0.0 /100 | #309 | Tragic $83,311 |
| Immigrants | Haiti | 0.0 /100 | #310 | Tragic $83,257 |
| Immigrants | Bahamas | 0.0 /100 | #311 | Tragic $83,177 |