Nicaraguan vs Immigrants from Kenya Householder Income Ages 45 - 64 years
COMPARE
Nicaraguan
Immigrants from Kenya
Householder Income Ages 45 - 64 years
Householder Income Ages 45 - 64 years Comparison
Nicaraguans
Immigrants from Kenya
$92,554
HOUSEHOLDER INCOME AGES 45 - 64 YEARS
2.0/ 100
METRIC RATING
235th/ 347
METRIC RANK
$97,964
HOUSEHOLDER INCOME AGES 45 - 64 YEARS
23.5/ 100
METRIC RATING
200th/ 347
METRIC RANK
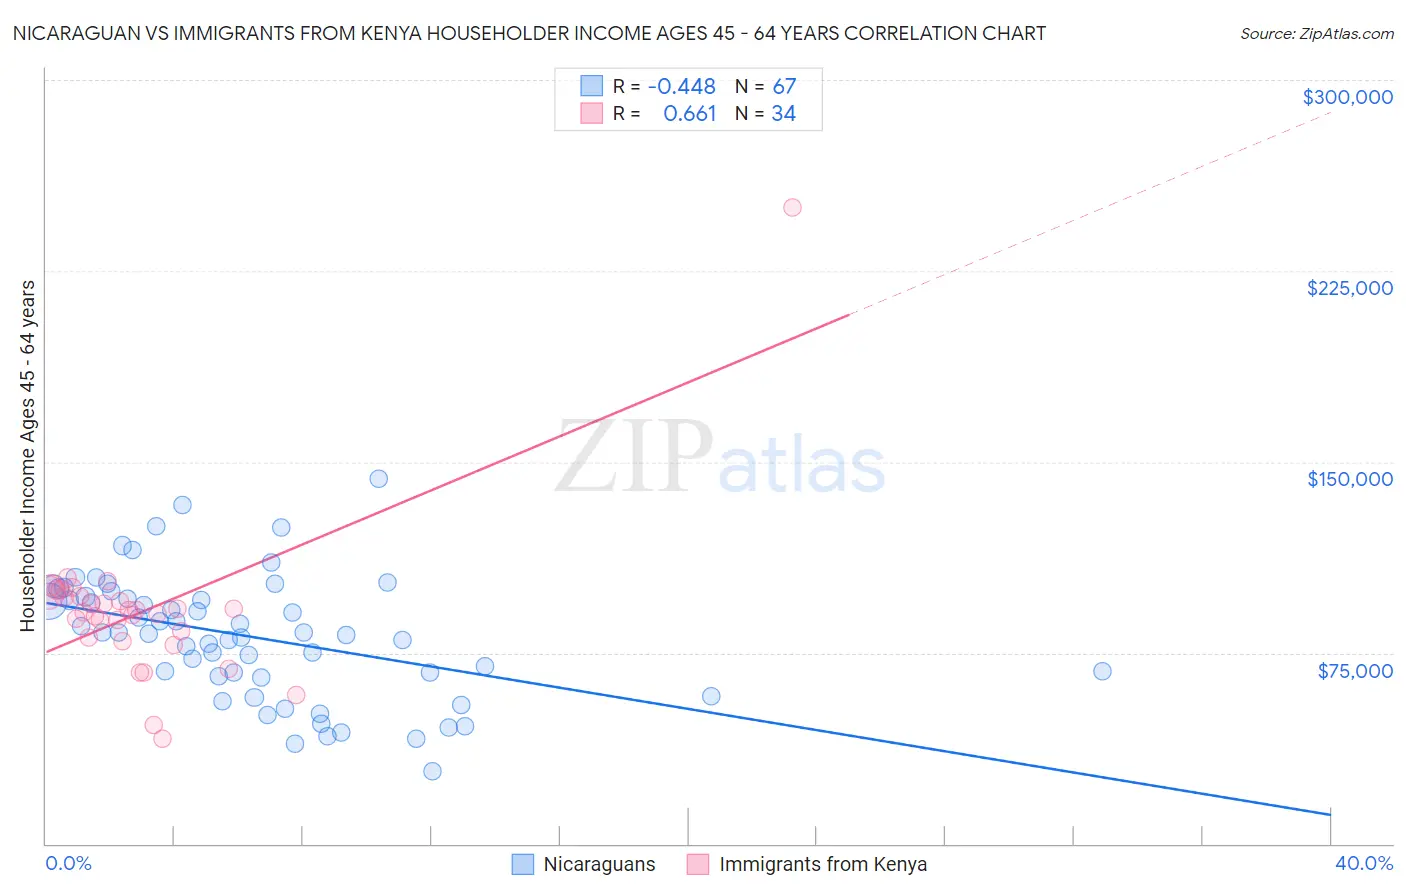
Nicaraguan vs Immigrants from Kenya Householder Income Ages 45 - 64 years Correlation Chart
The statistical analysis conducted on geographies consisting of 285,455,772 people shows a moderate negative correlation between the proportion of Nicaraguans and household income with householder between the ages 45 and 64 in the United States with a correlation coefficient (R) of -0.448 and weighted average of $92,554. Similarly, the statistical analysis conducted on geographies consisting of 217,894,820 people shows a significant positive correlation between the proportion of Immigrants from Kenya and household income with householder between the ages 45 and 64 in the United States with a correlation coefficient (R) of 0.661 and weighted average of $97,964, a difference of 5.9%.
Householder Income Ages 45 - 64 years Correlation Summary
| Measurement | Nicaraguan | Immigrants from Kenya |
| Minimum | $28,333 | $41,343 |
| Maximum | $143,278 | $250,001 |
| Range | $114,945 | $208,658 |
| Mean | $81,452 | $91,195 |
| Median | $82,750 | $91,314 |
| Interquartile 25% (IQ1) | $65,957 | $80,833 |
| Interquartile 75% (IQ3) | $97,029 | $97,063 |
| Interquartile Range (IQR) | $31,072 | $16,231 |
| Standard Deviation (Sample) | $24,263 | $31,961 |
| Standard Deviation (Population) | $24,082 | $31,487 |
Similar Demographics by Householder Income Ages 45 - 64 years
Demographics Similar to Nicaraguans by Householder Income Ages 45 - 64 years
In terms of householder income ages 45 - 64 years, the demographic groups most similar to Nicaraguans are Immigrants from Western Africa ($92,384, a difference of 0.18%), Immigrants from Bangladesh ($92,208, a difference of 0.37%), Pennsylvania German ($91,956, a difference of 0.65%), Immigrants from El Salvador ($93,176, a difference of 0.67%), and Nepalese ($93,355, a difference of 0.87%).
| Demographics | Rating | Rank | Householder Income Ages 45 - 64 years |
| Immigrants | Panama | 3.7 /100 | #228 | Tragic $93,815 |
| Vietnamese | 3.6 /100 | #229 | Tragic $93,788 |
| Immigrants | Sudan | 3.6 /100 | #230 | Tragic $93,781 |
| Ecuadorians | 3.6 /100 | #231 | Tragic $93,739 |
| Sudanese | 3.5 /100 | #232 | Tragic $93,718 |
| Nepalese | 3.0 /100 | #233 | Tragic $93,355 |
| Immigrants | El Salvador | 2.7 /100 | #234 | Tragic $93,176 |
| Nicaraguans | 2.0 /100 | #235 | Tragic $92,554 |
| Immigrants | Western Africa | 1.8 /100 | #236 | Tragic $92,384 |
| Immigrants | Bangladesh | 1.7 /100 | #237 | Tragic $92,208 |
| Pennsylvania Germans | 1.5 /100 | #238 | Tragic $91,956 |
| Immigrants | Ecuador | 1.2 /100 | #239 | Tragic $91,462 |
| Immigrants | Burma/Myanmar | 1.1 /100 | #240 | Tragic $91,385 |
| Trinidadians and Tobagonians | 1.1 /100 | #241 | Tragic $91,357 |
| Inupiat | 1.1 /100 | #242 | Tragic $91,355 |
Demographics Similar to Immigrants from Kenya by Householder Income Ages 45 - 64 years
In terms of householder income ages 45 - 64 years, the demographic groups most similar to Immigrants from Kenya are White/Caucasian ($98,091, a difference of 0.13%), Immigrants from Iraq ($98,201, a difference of 0.24%), Puget Sound Salish ($98,340, a difference of 0.38%), Yugoslavian ($97,558, a difference of 0.42%), and Immigrants from Eastern Africa ($98,467, a difference of 0.51%).
| Demographics | Rating | Rank | Householder Income Ages 45 - 64 years |
| Hawaiians | 31.6 /100 | #193 | Fair $98,778 |
| Uruguayans | 30.3 /100 | #194 | Fair $98,660 |
| Spanish | 29.2 /100 | #195 | Fair $98,554 |
| Immigrants | Eastern Africa | 28.3 /100 | #196 | Fair $98,467 |
| Puget Sound Salish | 27.0 /100 | #197 | Fair $98,340 |
| Immigrants | Iraq | 25.7 /100 | #198 | Fair $98,201 |
| Whites/Caucasians | 24.6 /100 | #199 | Fair $98,091 |
| Immigrants | Kenya | 23.5 /100 | #200 | Fair $97,964 |
| Yugoslavians | 20.0 /100 | #201 | Fair $97,558 |
| Tlingit-Haida | 18.9 /100 | #202 | Poor $97,417 |
| Immigrants | Thailand | 18.8 /100 | #203 | Poor $97,400 |
| Immigrants | Eritrea | 18.6 /100 | #204 | Poor $97,373 |
| Immigrants | Colombia | 18.0 /100 | #205 | Poor $97,290 |
| Immigrants | Africa | 17.9 /100 | #206 | Poor $97,284 |
| Ghanaians | 17.9 /100 | #207 | Poor $97,277 |