Nicaraguan vs Immigrants from Belarus Householder Income Ages 45 - 64 years
COMPARE
Nicaraguan
Immigrants from Belarus
Householder Income Ages 45 - 64 years
Householder Income Ages 45 - 64 years Comparison
Nicaraguans
Immigrants from Belarus
$92,554
HOUSEHOLDER INCOME AGES 45 - 64 YEARS
2.0/ 100
METRIC RATING
235th/ 347
METRIC RANK
$111,430
HOUSEHOLDER INCOME AGES 45 - 64 YEARS
99.6/ 100
METRIC RATING
65th/ 347
METRIC RANK
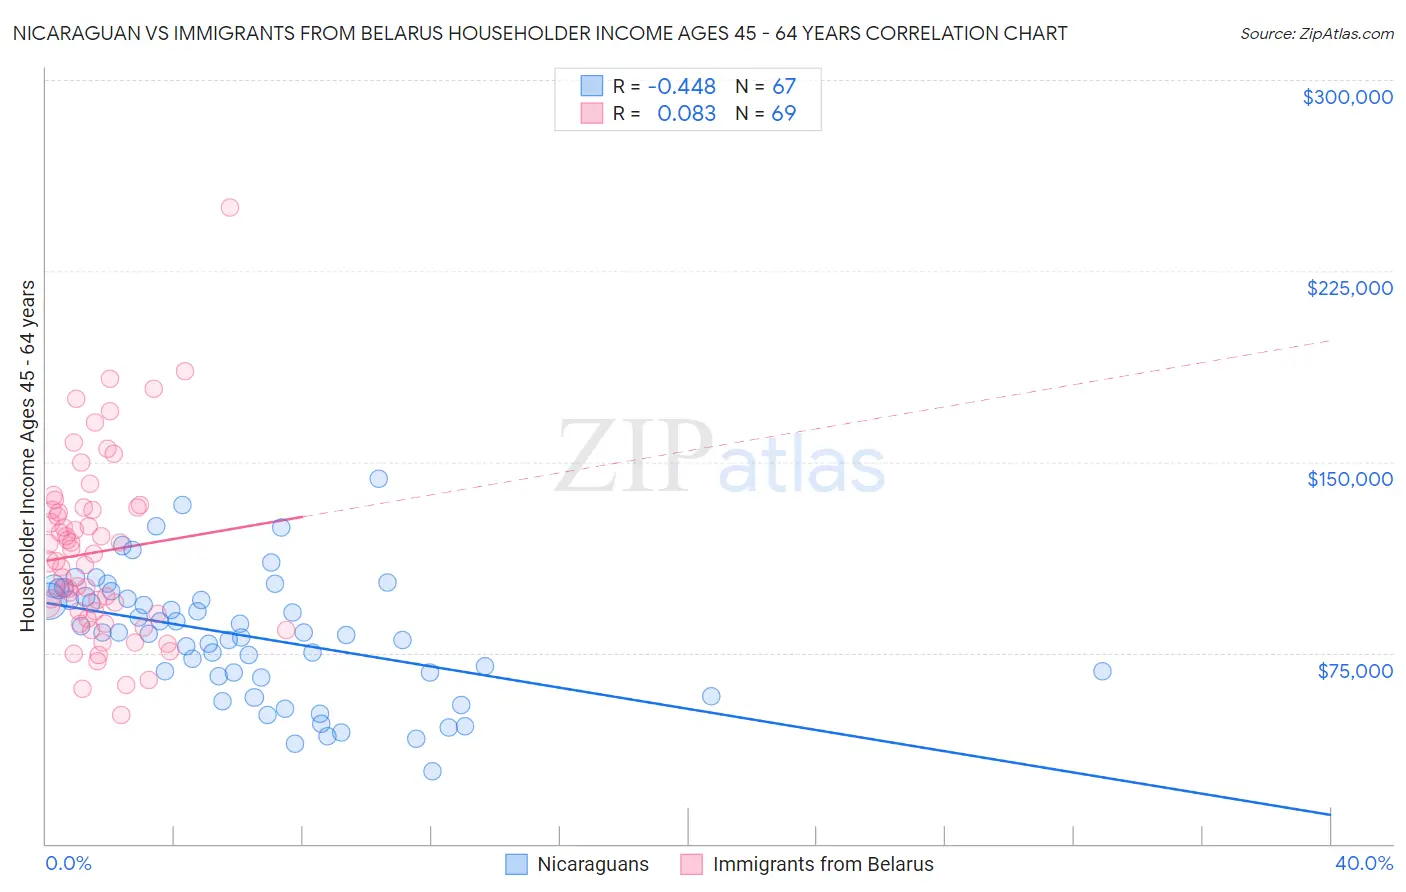
Nicaraguan vs Immigrants from Belarus Householder Income Ages 45 - 64 years Correlation Chart
The statistical analysis conducted on geographies consisting of 285,455,772 people shows a moderate negative correlation between the proportion of Nicaraguans and household income with householder between the ages 45 and 64 in the United States with a correlation coefficient (R) of -0.448 and weighted average of $92,554. Similarly, the statistical analysis conducted on geographies consisting of 150,153,617 people shows a slight positive correlation between the proportion of Immigrants from Belarus and household income with householder between the ages 45 and 64 in the United States with a correlation coefficient (R) of 0.083 and weighted average of $111,430, a difference of 20.4%.
Householder Income Ages 45 - 64 years Correlation Summary
| Measurement | Nicaraguan | Immigrants from Belarus |
| Minimum | $28,333 | $50,645 |
| Maximum | $143,278 | $250,001 |
| Range | $114,945 | $199,356 |
| Mean | $81,452 | $114,531 |
| Median | $82,750 | $110,936 |
| Interquartile 25% (IQ1) | $65,957 | $89,337 |
| Interquartile 75% (IQ3) | $97,029 | $131,465 |
| Interquartile Range (IQR) | $31,072 | $42,127 |
| Standard Deviation (Sample) | $24,263 | $35,174 |
| Standard Deviation (Population) | $24,082 | $34,918 |
Similar Demographics by Householder Income Ages 45 - 64 years
Demographics Similar to Nicaraguans by Householder Income Ages 45 - 64 years
In terms of householder income ages 45 - 64 years, the demographic groups most similar to Nicaraguans are Immigrants from Western Africa ($92,384, a difference of 0.18%), Immigrants from Bangladesh ($92,208, a difference of 0.37%), Pennsylvania German ($91,956, a difference of 0.65%), Immigrants from El Salvador ($93,176, a difference of 0.67%), and Nepalese ($93,355, a difference of 0.87%).
| Demographics | Rating | Rank | Householder Income Ages 45 - 64 years |
| Immigrants | Panama | 3.7 /100 | #228 | Tragic $93,815 |
| Vietnamese | 3.6 /100 | #229 | Tragic $93,788 |
| Immigrants | Sudan | 3.6 /100 | #230 | Tragic $93,781 |
| Ecuadorians | 3.6 /100 | #231 | Tragic $93,739 |
| Sudanese | 3.5 /100 | #232 | Tragic $93,718 |
| Nepalese | 3.0 /100 | #233 | Tragic $93,355 |
| Immigrants | El Salvador | 2.7 /100 | #234 | Tragic $93,176 |
| Nicaraguans | 2.0 /100 | #235 | Tragic $92,554 |
| Immigrants | Western Africa | 1.8 /100 | #236 | Tragic $92,384 |
| Immigrants | Bangladesh | 1.7 /100 | #237 | Tragic $92,208 |
| Pennsylvania Germans | 1.5 /100 | #238 | Tragic $91,956 |
| Immigrants | Ecuador | 1.2 /100 | #239 | Tragic $91,462 |
| Immigrants | Burma/Myanmar | 1.1 /100 | #240 | Tragic $91,385 |
| Trinidadians and Tobagonians | 1.1 /100 | #241 | Tragic $91,357 |
| Inupiat | 1.1 /100 | #242 | Tragic $91,355 |
Demographics Similar to Immigrants from Belarus by Householder Income Ages 45 - 64 years
In terms of householder income ages 45 - 64 years, the demographic groups most similar to Immigrants from Belarus are Immigrants from Latvia ($111,454, a difference of 0.020%), New Zealander ($111,286, a difference of 0.13%), Mongolian ($111,602, a difference of 0.15%), Immigrants from Norway ($111,669, a difference of 0.21%), and Laotian ($111,051, a difference of 0.34%).
| Demographics | Rating | Rank | Householder Income Ages 45 - 64 years |
| Soviet Union | 99.7 /100 | #58 | Exceptional $112,008 |
| Immigrants | Europe | 99.7 /100 | #59 | Exceptional $111,984 |
| Immigrants | Netherlands | 99.7 /100 | #60 | Exceptional $111,982 |
| Immigrants | Czechoslovakia | 99.7 /100 | #61 | Exceptional $111,914 |
| Immigrants | Norway | 99.7 /100 | #62 | Exceptional $111,669 |
| Mongolians | 99.6 /100 | #63 | Exceptional $111,602 |
| Immigrants | Latvia | 99.6 /100 | #64 | Exceptional $111,454 |
| Immigrants | Belarus | 99.6 /100 | #65 | Exceptional $111,430 |
| New Zealanders | 99.6 /100 | #66 | Exceptional $111,286 |
| Laotians | 99.5 /100 | #67 | Exceptional $111,051 |
| Immigrants | Romania | 99.4 /100 | #68 | Exceptional $110,633 |
| Immigrants | Italy | 99.4 /100 | #69 | Exceptional $110,434 |
| Koreans | 99.3 /100 | #70 | Exceptional $110,334 |
| Italians | 99.3 /100 | #71 | Exceptional $110,224 |
| Assyrians/Chaldeans/Syriacs | 99.3 /100 | #72 | Exceptional $110,201 |