Nicaraguan vs Serbian Householder Income Ages 45 - 64 years
COMPARE
Nicaraguan
Serbian
Householder Income Ages 45 - 64 years
Householder Income Ages 45 - 64 years Comparison
Nicaraguans
Serbians
$92,554
HOUSEHOLDER INCOME AGES 45 - 64 YEARS
2.0/ 100
METRIC RATING
235th/ 347
METRIC RANK
$103,522
HOUSEHOLDER INCOME AGES 45 - 64 YEARS
83.2/ 100
METRIC RATING
143rd/ 347
METRIC RANK
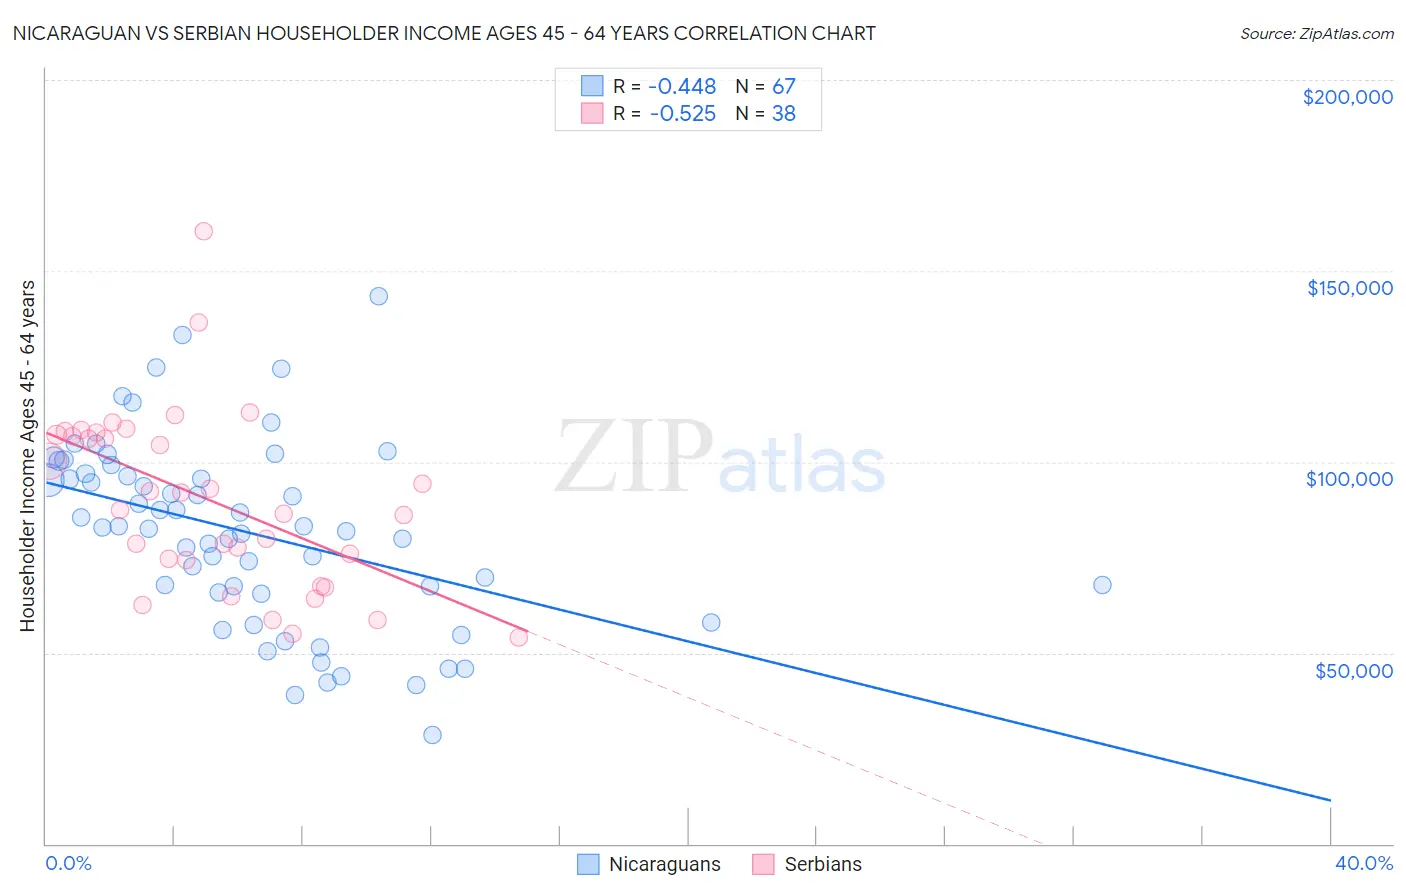
Nicaraguan vs Serbian Householder Income Ages 45 - 64 years Correlation Chart
The statistical analysis conducted on geographies consisting of 285,455,772 people shows a moderate negative correlation between the proportion of Nicaraguans and household income with householder between the ages 45 and 64 in the United States with a correlation coefficient (R) of -0.448 and weighted average of $92,554. Similarly, the statistical analysis conducted on geographies consisting of 267,315,581 people shows a substantial negative correlation between the proportion of Serbians and household income with householder between the ages 45 and 64 in the United States with a correlation coefficient (R) of -0.525 and weighted average of $103,522, a difference of 11.8%.
Householder Income Ages 45 - 64 years Correlation Summary
| Measurement | Nicaraguan | Serbian |
| Minimum | $28,333 | $53,958 |
| Maximum | $143,278 | $160,260 |
| Range | $114,945 | $106,302 |
| Mean | $81,452 | $89,963 |
| Median | $82,750 | $89,813 |
| Interquartile 25% (IQ1) | $65,957 | $74,285 |
| Interquartile 75% (IQ3) | $97,029 | $107,140 |
| Interquartile Range (IQR) | $31,072 | $32,855 |
| Standard Deviation (Sample) | $24,263 | $23,322 |
| Standard Deviation (Population) | $24,082 | $23,014 |
Similar Demographics by Householder Income Ages 45 - 64 years
Demographics Similar to Nicaraguans by Householder Income Ages 45 - 64 years
In terms of householder income ages 45 - 64 years, the demographic groups most similar to Nicaraguans are Immigrants from Western Africa ($92,384, a difference of 0.18%), Immigrants from Bangladesh ($92,208, a difference of 0.37%), Pennsylvania German ($91,956, a difference of 0.65%), Immigrants from El Salvador ($93,176, a difference of 0.67%), and Nepalese ($93,355, a difference of 0.87%).
| Demographics | Rating | Rank | Householder Income Ages 45 - 64 years |
| Immigrants | Panama | 3.7 /100 | #228 | Tragic $93,815 |
| Vietnamese | 3.6 /100 | #229 | Tragic $93,788 |
| Immigrants | Sudan | 3.6 /100 | #230 | Tragic $93,781 |
| Ecuadorians | 3.6 /100 | #231 | Tragic $93,739 |
| Sudanese | 3.5 /100 | #232 | Tragic $93,718 |
| Nepalese | 3.0 /100 | #233 | Tragic $93,355 |
| Immigrants | El Salvador | 2.7 /100 | #234 | Tragic $93,176 |
| Nicaraguans | 2.0 /100 | #235 | Tragic $92,554 |
| Immigrants | Western Africa | 1.8 /100 | #236 | Tragic $92,384 |
| Immigrants | Bangladesh | 1.7 /100 | #237 | Tragic $92,208 |
| Pennsylvania Germans | 1.5 /100 | #238 | Tragic $91,956 |
| Immigrants | Ecuador | 1.2 /100 | #239 | Tragic $91,462 |
| Immigrants | Burma/Myanmar | 1.1 /100 | #240 | Tragic $91,385 |
| Trinidadians and Tobagonians | 1.1 /100 | #241 | Tragic $91,357 |
| Inupiat | 1.1 /100 | #242 | Tragic $91,355 |
Demographics Similar to Serbians by Householder Income Ages 45 - 64 years
In terms of householder income ages 45 - 64 years, the demographic groups most similar to Serbians are Luxembourger ($103,536, a difference of 0.010%), Czech ($103,507, a difference of 0.010%), Ugandan ($103,472, a difference of 0.050%), Immigrants from Uganda ($103,584, a difference of 0.060%), and Immigrants from Chile ($103,412, a difference of 0.11%).
| Demographics | Rating | Rank | Householder Income Ages 45 - 64 years |
| Taiwanese | 87.4 /100 | #136 | Excellent $104,180 |
| Hungarians | 85.8 /100 | #137 | Excellent $103,913 |
| Ethiopians | 84.7 /100 | #138 | Excellent $103,736 |
| Immigrants | Oceania | 84.5 /100 | #139 | Excellent $103,705 |
| Norwegians | 84.3 /100 | #140 | Excellent $103,682 |
| Immigrants | Uganda | 83.7 /100 | #141 | Excellent $103,584 |
| Luxembourgers | 83.3 /100 | #142 | Excellent $103,536 |
| Serbians | 83.2 /100 | #143 | Excellent $103,522 |
| Czechs | 83.1 /100 | #144 | Excellent $103,507 |
| Ugandans | 82.9 /100 | #145 | Excellent $103,472 |
| Immigrants | Chile | 82.5 /100 | #146 | Excellent $103,412 |
| Basques | 82.3 /100 | #147 | Excellent $103,387 |
| Immigrants | Germany | 81.5 /100 | #148 | Excellent $103,282 |
| Immigrants | Sierra Leone | 81.1 /100 | #149 | Excellent $103,227 |
| Immigrants | Peru | 80.7 /100 | #150 | Excellent $103,173 |