New Zealander vs Immigrants from Uruguay Median Earnings
COMPARE
New Zealander
Immigrants from Uruguay
Median Earnings
Median Earnings Comparison
New Zealanders
Immigrants from Uruguay
$51,246
MEDIAN EARNINGS
99.9/ 100
METRIC RATING
64th/ 347
METRIC RANK
$45,682
MEDIAN EARNINGS
25.9/ 100
METRIC RATING
204th/ 347
METRIC RANK
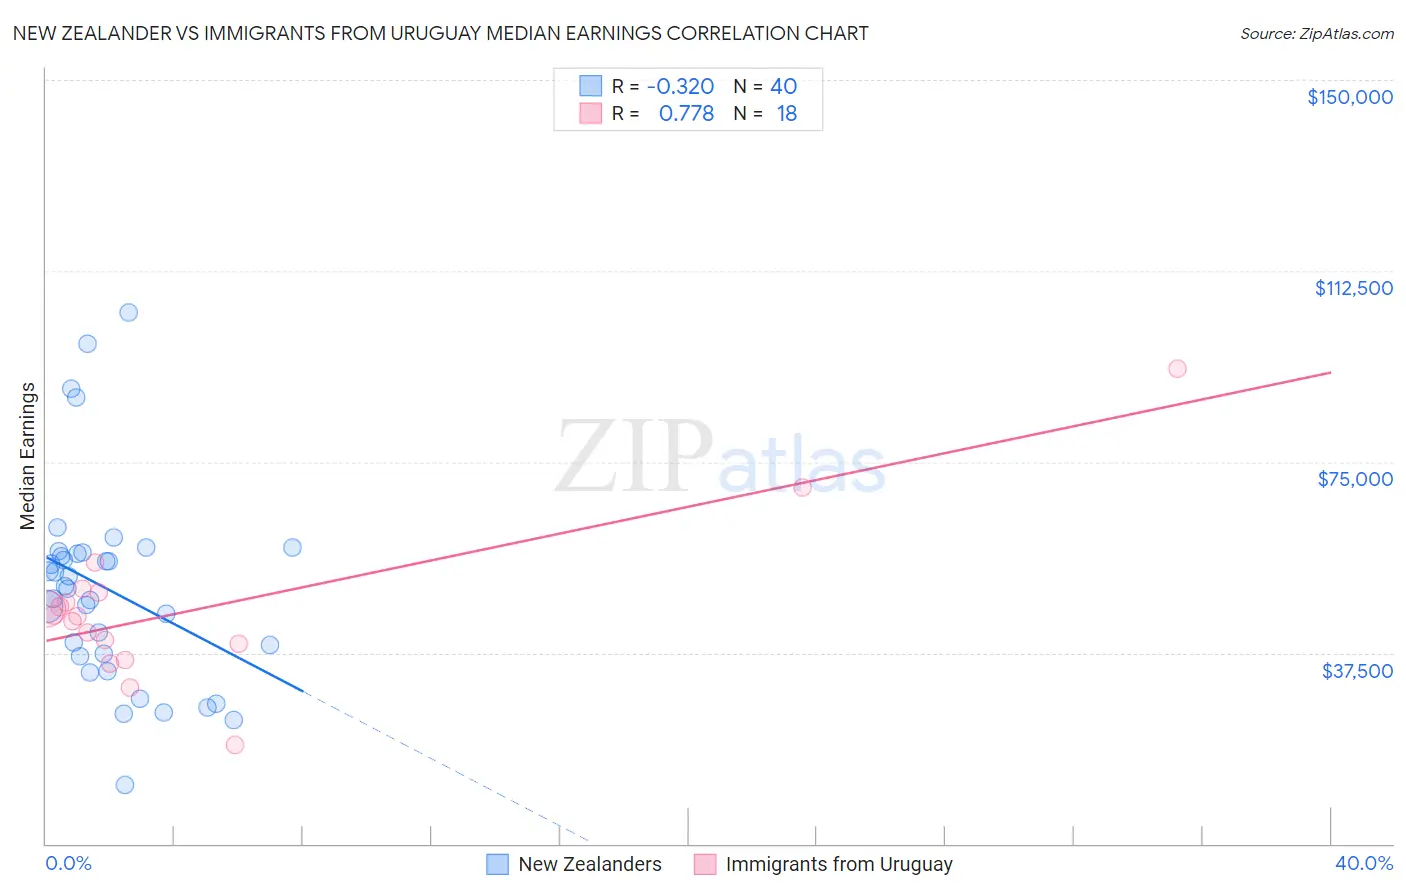
New Zealander vs Immigrants from Uruguay Median Earnings Correlation Chart
The statistical analysis conducted on geographies consisting of 106,916,811 people shows a mild negative correlation between the proportion of New Zealanders and median earnings in the United States with a correlation coefficient (R) of -0.320 and weighted average of $51,246. Similarly, the statistical analysis conducted on geographies consisting of 133,259,667 people shows a strong positive correlation between the proportion of Immigrants from Uruguay and median earnings in the United States with a correlation coefficient (R) of 0.778 and weighted average of $45,682, a difference of 12.2%.
Median Earnings Correlation Summary
| Measurement | New Zealander | Immigrants from Uruguay |
| Minimum | $11,591 | $19,375 |
| Maximum | $104,409 | $93,387 |
| Range | $92,818 | $74,012 |
| Mean | $49,845 | $46,310 |
| Median | $50,398 | $44,791 |
| Interquartile 25% (IQ1) | $37,107 | $39,250 |
| Interquartile 75% (IQ3) | $57,034 | $49,312 |
| Interquartile Range (IQR) | $19,927 | $10,062 |
| Standard Deviation (Sample) | $19,630 | $15,725 |
| Standard Deviation (Population) | $19,383 | $15,282 |
Similar Demographics by Median Earnings
Demographics Similar to New Zealanders by Median Earnings
In terms of median earnings, the demographic groups most similar to New Zealanders are Immigrants from Bulgaria ($51,318, a difference of 0.14%), Greek ($51,164, a difference of 0.16%), Immigrants from Romania ($51,337, a difference of 0.18%), Afghan ($51,112, a difference of 0.26%), and Immigrants from Spain ($51,092, a difference of 0.30%).
| Demographics | Rating | Rank | Median Earnings |
| Immigrants | Eastern Europe | 99.9 /100 | #57 | Exceptional $51,624 |
| Immigrants | Bolivia | 99.9 /100 | #58 | Exceptional $51,605 |
| Immigrants | Croatia | 99.9 /100 | #59 | Exceptional $51,581 |
| Immigrants | Serbia | 99.9 /100 | #60 | Exceptional $51,557 |
| Immigrants | Latvia | 99.9 /100 | #61 | Exceptional $51,555 |
| Immigrants | Romania | 99.9 /100 | #62 | Exceptional $51,337 |
| Immigrants | Bulgaria | 99.9 /100 | #63 | Exceptional $51,318 |
| New Zealanders | 99.9 /100 | #64 | Exceptional $51,246 |
| Greeks | 99.9 /100 | #65 | Exceptional $51,164 |
| Afghans | 99.9 /100 | #66 | Exceptional $51,112 |
| Immigrants | Spain | 99.9 /100 | #67 | Exceptional $51,092 |
| Paraguayans | 99.9 /100 | #68 | Exceptional $51,068 |
| Mongolians | 99.8 /100 | #69 | Exceptional $51,038 |
| Lithuanians | 99.8 /100 | #70 | Exceptional $50,991 |
| Immigrants | Ukraine | 99.8 /100 | #71 | Exceptional $50,984 |
Demographics Similar to Immigrants from Uruguay by Median Earnings
In terms of median earnings, the demographic groups most similar to Immigrants from Uruguay are Tongan ($45,665, a difference of 0.040%), Welsh ($45,710, a difference of 0.060%), Immigrants from Ghana ($45,641, a difference of 0.090%), Immigrants from Trinidad and Tobago ($45,729, a difference of 0.10%), and Celtic ($45,732, a difference of 0.11%).
| Demographics | Rating | Rank | Median Earnings |
| Barbadians | 30.5 /100 | #197 | Fair $45,846 |
| Trinidadians and Tobagonians | 29.7 /100 | #198 | Fair $45,820 |
| Immigrants | Barbados | 29.6 /100 | #199 | Fair $45,816 |
| Immigrants | Azores | 29.5 /100 | #200 | Fair $45,812 |
| Celtics | 27.2 /100 | #201 | Fair $45,732 |
| Immigrants | Trinidad and Tobago | 27.1 /100 | #202 | Fair $45,729 |
| Welsh | 26.6 /100 | #203 | Fair $45,710 |
| Immigrants | Uruguay | 25.9 /100 | #204 | Fair $45,682 |
| Tongans | 25.4 /100 | #205 | Fair $45,665 |
| Immigrants | Ghana | 24.8 /100 | #206 | Fair $45,641 |
| Immigrants | Senegal | 24.0 /100 | #207 | Fair $45,611 |
| Immigrants | Bosnia and Herzegovina | 23.7 /100 | #208 | Fair $45,600 |
| Immigrants | Thailand | 23.7 /100 | #209 | Fair $45,598 |
| Immigrants | Grenada | 23.6 /100 | #210 | Fair $45,596 |
| Panamanians | 23.5 /100 | #211 | Fair $45,593 |