Navajo vs Maltese Median Family Income
COMPARE
Navajo
Maltese
Median Family Income
Median Family Income Comparison
Navajo
Maltese
$70,989
MEDIAN FAMILY INCOME
0.0/ 100
METRIC RATING
345th/ 347
METRIC RANK
$115,862
MEDIAN FAMILY INCOME
99.9/ 100
METRIC RATING
52nd/ 347
METRIC RANK
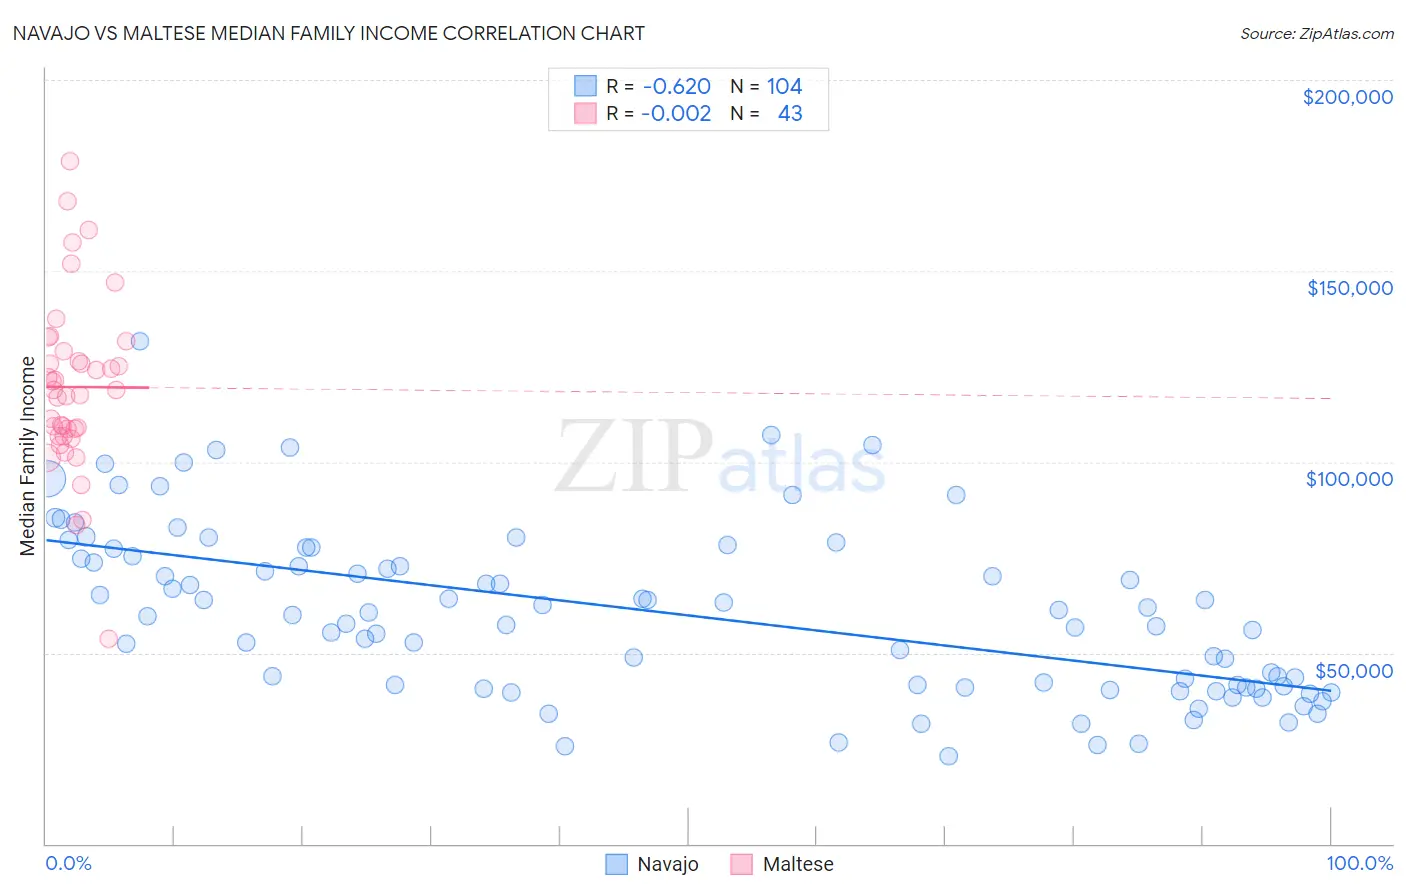
Navajo vs Maltese Median Family Income Correlation Chart
The statistical analysis conducted on geographies consisting of 224,690,436 people shows a significant negative correlation between the proportion of Navajo and median family income in the United States with a correlation coefficient (R) of -0.620 and weighted average of $70,989. Similarly, the statistical analysis conducted on geographies consisting of 126,250,272 people shows no correlation between the proportion of Maltese and median family income in the United States with a correlation coefficient (R) of -0.002 and weighted average of $115,862, a difference of 63.2%.
Median Family Income Correlation Summary
| Measurement | Navajo | Maltese |
| Minimum | $22,955 | $53,672 |
| Maximum | $131,574 | $178,781 |
| Range | $108,619 | $125,109 |
| Mean | $60,376 | $119,621 |
| Median | $59,766 | $118,717 |
| Interquartile 25% (IQ1) | $41,038 | $106,808 |
| Interquartile 75% (IQ3) | $74,887 | $128,909 |
| Interquartile Range (IQR) | $33,849 | $22,102 |
| Standard Deviation (Sample) | $22,079 | $22,839 |
| Standard Deviation (Population) | $21,972 | $22,571 |
Similar Demographics by Median Family Income
Demographics Similar to Navajo by Median Family Income
In terms of median family income, the demographic groups most similar to Navajo are Puerto Rican ($70,423, a difference of 0.80%), Tohono O'odham ($72,193, a difference of 1.7%), Lumbee ($68,679, a difference of 3.4%), Houma ($76,188, a difference of 7.3%), and Crow ($76,605, a difference of 7.9%).
| Demographics | Rating | Rank | Median Family Income |
| Kiowa | 0.0 /100 | #333 | Tragic $80,885 |
| Menominee | 0.0 /100 | #334 | Tragic $79,563 |
| Yup'ik | 0.0 /100 | #335 | Tragic $79,290 |
| Immigrants | Cuba | 0.0 /100 | #336 | Tragic $78,249 |
| Yuman | 0.0 /100 | #337 | Tragic $78,055 |
| Immigrants | Yemen | 0.0 /100 | #338 | Tragic $77,457 |
| Pima | 0.0 /100 | #339 | Tragic $77,431 |
| Hopi | 0.0 /100 | #340 | Tragic $77,188 |
| Pueblo | 0.0 /100 | #341 | Tragic $76,880 |
| Crow | 0.0 /100 | #342 | Tragic $76,605 |
| Houma | 0.0 /100 | #343 | Tragic $76,188 |
| Tohono O'odham | 0.0 /100 | #344 | Tragic $72,193 |
| Navajo | 0.0 /100 | #345 | Tragic $70,989 |
| Puerto Ricans | 0.0 /100 | #346 | Tragic $70,423 |
| Lumbee | 0.0 /100 | #347 | Tragic $68,679 |
Demographics Similar to Maltese by Median Family Income
In terms of median family income, the demographic groups most similar to Maltese are Immigrants from Malaysia ($115,880, a difference of 0.010%), Immigrants from Norway ($115,847, a difference of 0.010%), Immigrants from Czechoslovakia ($116,165, a difference of 0.26%), Chinese ($116,188, a difference of 0.28%), and Immigrants from Europe ($115,523, a difference of 0.29%).
| Demographics | Rating | Rank | Median Family Income |
| Immigrants | Greece | 99.9 /100 | #45 | Exceptional $117,344 |
| Immigrants | Russia | 99.9 /100 | #46 | Exceptional $116,942 |
| Immigrants | Austria | 99.9 /100 | #47 | Exceptional $116,830 |
| Immigrants | South Africa | 99.9 /100 | #48 | Exceptional $116,286 |
| Chinese | 99.9 /100 | #49 | Exceptional $116,188 |
| Immigrants | Czechoslovakia | 99.9 /100 | #50 | Exceptional $116,165 |
| Immigrants | Malaysia | 99.9 /100 | #51 | Exceptional $115,880 |
| Maltese | 99.9 /100 | #52 | Exceptional $115,862 |
| Immigrants | Norway | 99.9 /100 | #53 | Exceptional $115,847 |
| Immigrants | Europe | 99.9 /100 | #54 | Exceptional $115,523 |
| Lithuanians | 99.8 /100 | #55 | Exceptional $115,395 |
| New Zealanders | 99.8 /100 | #56 | Exceptional $115,230 |
| Greeks | 99.8 /100 | #57 | Exceptional $115,192 |
| Immigrants | Indonesia | 99.8 /100 | #58 | Exceptional $115,162 |
| Immigrants | Netherlands | 99.8 /100 | #59 | Exceptional $114,987 |