Navajo vs Black/African American Median Family Income
COMPARE
Navajo
Black/African American
Median Family Income
Median Family Income Comparison
Navajo
Blacks/African Americans
$70,989
MEDIAN FAMILY INCOME
0.0/ 100
METRIC RATING
345th/ 347
METRIC RANK
$81,912
MEDIAN FAMILY INCOME
0.0/ 100
METRIC RATING
328th/ 347
METRIC RANK
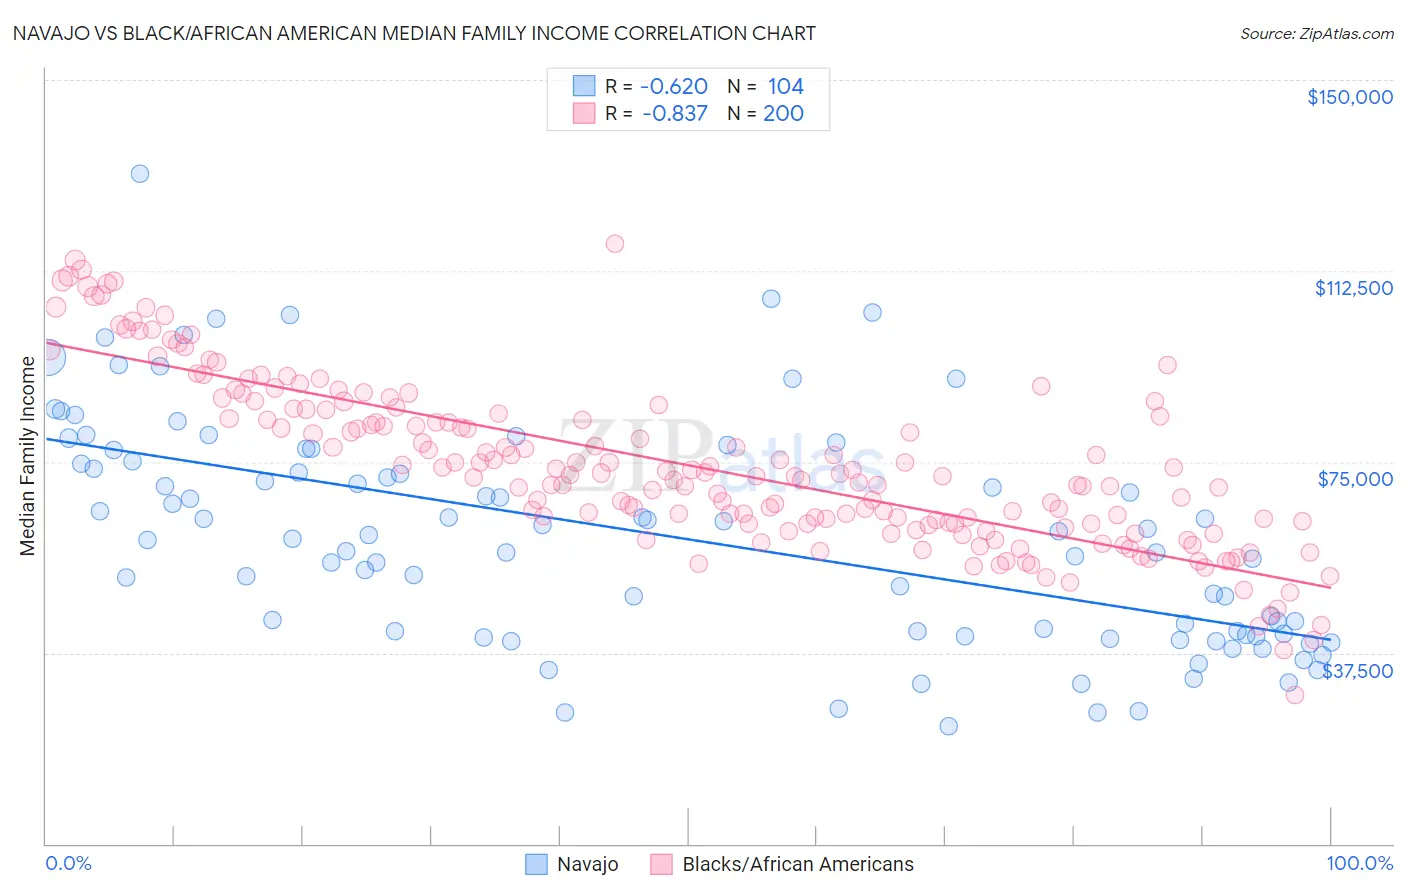
Navajo vs Black/African American Median Family Income Correlation Chart
The statistical analysis conducted on geographies consisting of 224,690,436 people shows a significant negative correlation between the proportion of Navajo and median family income in the United States with a correlation coefficient (R) of -0.620 and weighted average of $70,989. Similarly, the statistical analysis conducted on geographies consisting of 564,544,060 people shows a very strong negative correlation between the proportion of Blacks/African Americans and median family income in the United States with a correlation coefficient (R) of -0.837 and weighted average of $81,912, a difference of 15.4%.
Median Family Income Correlation Summary
| Measurement | Navajo | Black/African American |
| Minimum | $22,955 | $29,315 |
| Maximum | $131,574 | $117,822 |
| Range | $108,619 | $88,507 |
| Mean | $60,376 | $74,336 |
| Median | $59,766 | $72,335 |
| Interquartile 25% (IQ1) | $41,038 | $62,832 |
| Interquartile 75% (IQ3) | $74,887 | $85,289 |
| Interquartile Range (IQR) | $33,849 | $22,457 |
| Standard Deviation (Sample) | $22,079 | $16,637 |
| Standard Deviation (Population) | $21,972 | $16,596 |
Demographics Similar to Navajo and Blacks/African Americans by Median Family Income
In terms of median family income, the demographic groups most similar to Navajo are Puerto Rican ($70,423, a difference of 0.80%), Tohono O'odham ($72,193, a difference of 1.7%), Houma ($76,188, a difference of 7.3%), Crow ($76,605, a difference of 7.9%), and Pueblo ($76,880, a difference of 8.3%). Similarly, the demographic groups most similar to Blacks/African Americans are Dutch West Indian ($81,852, a difference of 0.070%), Arapaho ($82,064, a difference of 0.18%), Immigrants from Congo ($82,216, a difference of 0.37%), Cheyenne ($81,385, a difference of 0.65%), and Immigrants from Dominican Republic ($81,233, a difference of 0.84%).
| Demographics | Rating | Rank | Median Family Income |
| Immigrants | Congo | 0.0 /100 | #326 | Tragic $82,216 |
| Arapaho | 0.0 /100 | #327 | Tragic $82,064 |
| Blacks/African Americans | 0.0 /100 | #328 | Tragic $81,912 |
| Dutch West Indians | 0.0 /100 | #329 | Tragic $81,852 |
| Cheyenne | 0.0 /100 | #330 | Tragic $81,385 |
| Immigrants | Dominican Republic | 0.0 /100 | #331 | Tragic $81,233 |
| Natives/Alaskans | 0.0 /100 | #332 | Tragic $80,908 |
| Kiowa | 0.0 /100 | #333 | Tragic $80,885 |
| Menominee | 0.0 /100 | #334 | Tragic $79,563 |
| Yup'ik | 0.0 /100 | #335 | Tragic $79,290 |
| Immigrants | Cuba | 0.0 /100 | #336 | Tragic $78,249 |
| Yuman | 0.0 /100 | #337 | Tragic $78,055 |
| Immigrants | Yemen | 0.0 /100 | #338 | Tragic $77,457 |
| Pima | 0.0 /100 | #339 | Tragic $77,431 |
| Hopi | 0.0 /100 | #340 | Tragic $77,188 |
| Pueblo | 0.0 /100 | #341 | Tragic $76,880 |
| Crow | 0.0 /100 | #342 | Tragic $76,605 |
| Houma | 0.0 /100 | #343 | Tragic $76,188 |
| Tohono O'odham | 0.0 /100 | #344 | Tragic $72,193 |
| Navajo | 0.0 /100 | #345 | Tragic $70,989 |
| Puerto Ricans | 0.0 /100 | #346 | Tragic $70,423 |