Navajo vs Mongolian Unemployment Among Ages 55 to 59 years
COMPARE
Navajo
Mongolian
Unemployment Among Ages 55 to 59 years
Unemployment Among Ages 55 to 59 years Comparison
Navajo
Mongolians
6.7%
UNEMPLOYMENT AMONG AGES 55 TO 59 YEARS
0.0/ 100
METRIC RATING
336th/ 347
METRIC RANK
4.6%
UNEMPLOYMENT AMONG AGES 55 TO 59 YEARS
99.0/ 100
METRIC RATING
66th/ 347
METRIC RANK
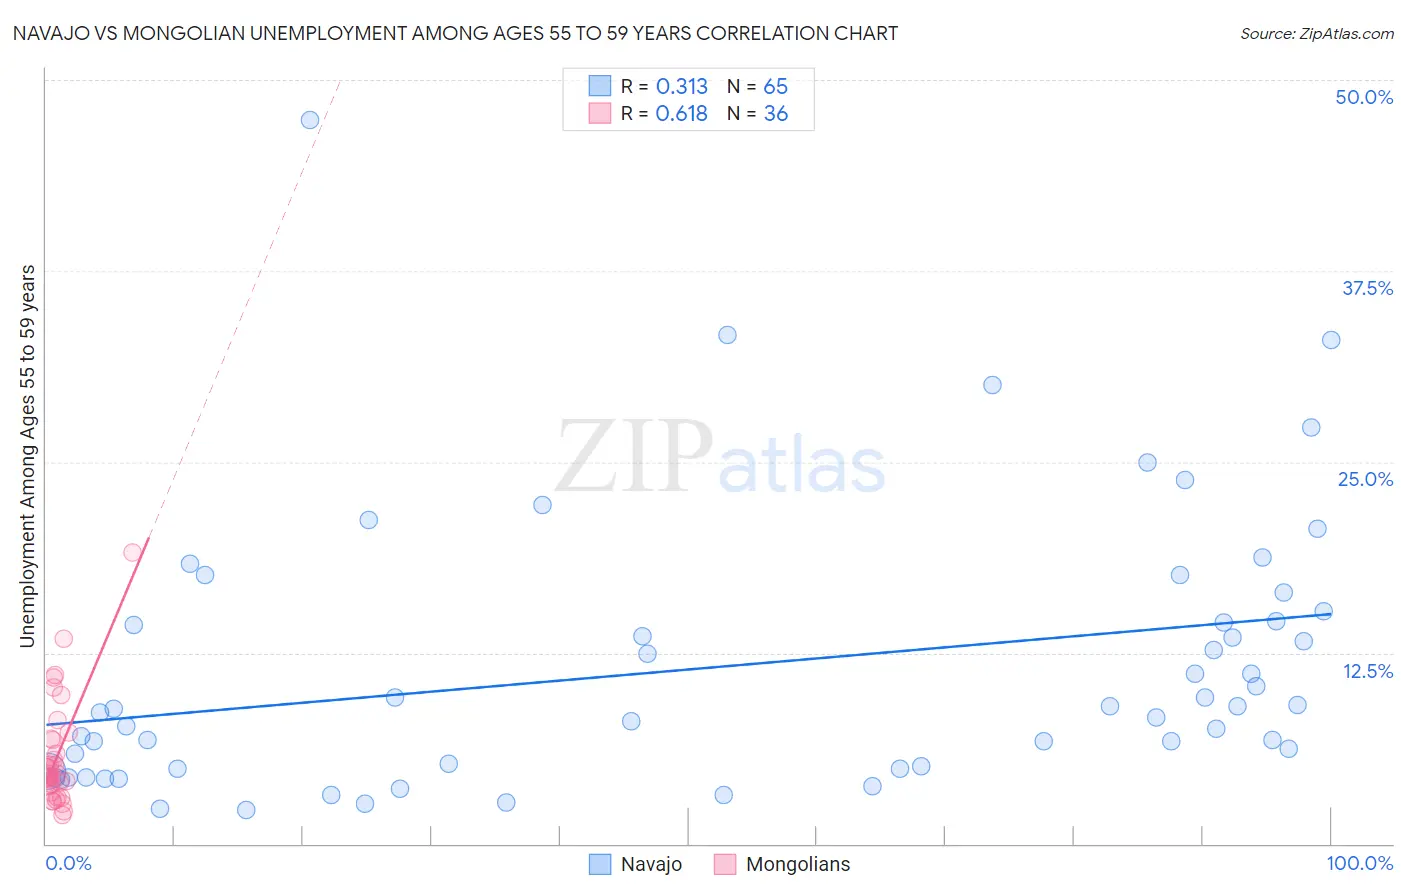
Navajo vs Mongolian Unemployment Among Ages 55 to 59 years Correlation Chart
The statistical analysis conducted on geographies consisting of 212,930,605 people shows a mild positive correlation between the proportion of Navajo and unemployment rate among population between the ages 55 and 59 in the United States with a correlation coefficient (R) of 0.313 and weighted average of 6.7%. Similarly, the statistical analysis conducted on geographies consisting of 137,147,690 people shows a significant positive correlation between the proportion of Mongolians and unemployment rate among population between the ages 55 and 59 in the United States with a correlation coefficient (R) of 0.618 and weighted average of 4.6%, a difference of 46.4%.
Unemployment Among Ages 55 to 59 years Correlation Summary
| Measurement | Navajo | Mongolian |
| Minimum | 2.2% | 1.9% |
| Maximum | 47.4% | 19.1% |
| Range | 45.2% | 17.2% |
| Mean | 11.6% | 5.7% |
| Median | 8.8% | 4.5% |
| Interquartile 25% (IQ1) | 4.9% | 3.6% |
| Interquartile 75% (IQ3) | 14.9% | 6.8% |
| Interquartile Range (IQR) | 10.0% | 3.3% |
| Standard Deviation (Sample) | 8.9% | 3.6% |
| Standard Deviation (Population) | 8.9% | 3.5% |
Similar Demographics by Unemployment Among Ages 55 to 59 years
Demographics Similar to Navajo by Unemployment Among Ages 55 to 59 years
In terms of unemployment among ages 55 to 59 years, the demographic groups most similar to Navajo are Colville (6.7%, a difference of 0.15%), Pueblo (6.7%, a difference of 0.33%), Paiute (6.8%, a difference of 0.52%), Pima (6.6%, a difference of 1.6%), and Immigrants from Yemen (6.9%, a difference of 2.5%).
| Demographics | Rating | Rank | Unemployment Among Ages 55 to 59 years |
| Dominicans | 0.0 /100 | #329 | Tragic 6.2% |
| Alaska Natives | 0.0 /100 | #330 | Tragic 6.2% |
| Immigrants | Dominican Republic | 0.0 /100 | #331 | Tragic 6.3% |
| Aleuts | 0.0 /100 | #332 | Tragic 6.4% |
| Pima | 0.0 /100 | #333 | Tragic 6.6% |
| Pueblo | 0.0 /100 | #334 | Tragic 6.7% |
| Colville | 0.0 /100 | #335 | Tragic 6.7% |
| Navajo | 0.0 /100 | #336 | Tragic 6.7% |
| Paiute | 0.0 /100 | #337 | Tragic 6.8% |
| Immigrants | Yemen | 0.0 /100 | #338 | Tragic 6.9% |
| Puerto Ricans | 0.0 /100 | #339 | Tragic 7.0% |
| Alaskan Athabascans | 0.0 /100 | #340 | Tragic 7.1% |
| Shoshone | 0.0 /100 | #341 | Tragic 7.4% |
| Hopi | 0.0 /100 | #342 | Tragic 8.1% |
| Yakama | 0.0 /100 | #343 | Tragic 8.9% |
Demographics Similar to Mongolians by Unemployment Among Ages 55 to 59 years
In terms of unemployment among ages 55 to 59 years, the demographic groups most similar to Mongolians are Ugandan (4.6%, a difference of 0.040%), Immigrants from Micronesia (4.6%, a difference of 0.050%), Czechoslovakian (4.6%, a difference of 0.060%), Argentinean (4.6%, a difference of 0.14%), and Sudanese (4.6%, a difference of 0.14%).
| Demographics | Rating | Rank | Unemployment Among Ages 55 to 59 years |
| Immigrants | Uganda | 99.5 /100 | #59 | Exceptional 4.6% |
| Dutch | 99.5 /100 | #60 | Exceptional 4.6% |
| Immigrants | Argentina | 99.5 /100 | #61 | Exceptional 4.6% |
| Slovenes | 99.3 /100 | #62 | Exceptional 4.6% |
| Immigrants | South Central Asia | 99.3 /100 | #63 | Exceptional 4.6% |
| Argentineans | 99.1 /100 | #64 | Exceptional 4.6% |
| Sudanese | 99.1 /100 | #65 | Exceptional 4.6% |
| Mongolians | 99.0 /100 | #66 | Exceptional 4.6% |
| Ugandans | 99.0 /100 | #67 | Exceptional 4.6% |
| Immigrants | Micronesia | 99.0 /100 | #68 | Exceptional 4.6% |
| Czechoslovakians | 99.0 /100 | #69 | Exceptional 4.6% |
| Filipinos | 98.8 /100 | #70 | Exceptional 4.6% |
| Immigrants | Jordan | 98.7 /100 | #71 | Exceptional 4.6% |
| Immigrants | Taiwan | 98.7 /100 | #72 | Exceptional 4.6% |
| Bhutanese | 98.6 /100 | #73 | Exceptional 4.6% |