Navajo vs Immigrants from Eastern Asia Median Family Income
COMPARE
Navajo
Immigrants from Eastern Asia
Median Family Income
Median Family Income Comparison
Navajo
Immigrants from Eastern Asia
$70,989
MEDIAN FAMILY INCOME
0.0/ 100
METRIC RATING
345th/ 347
METRIC RANK
$125,150
MEDIAN FAMILY INCOME
100.0/ 100
METRIC RATING
18th/ 347
METRIC RANK
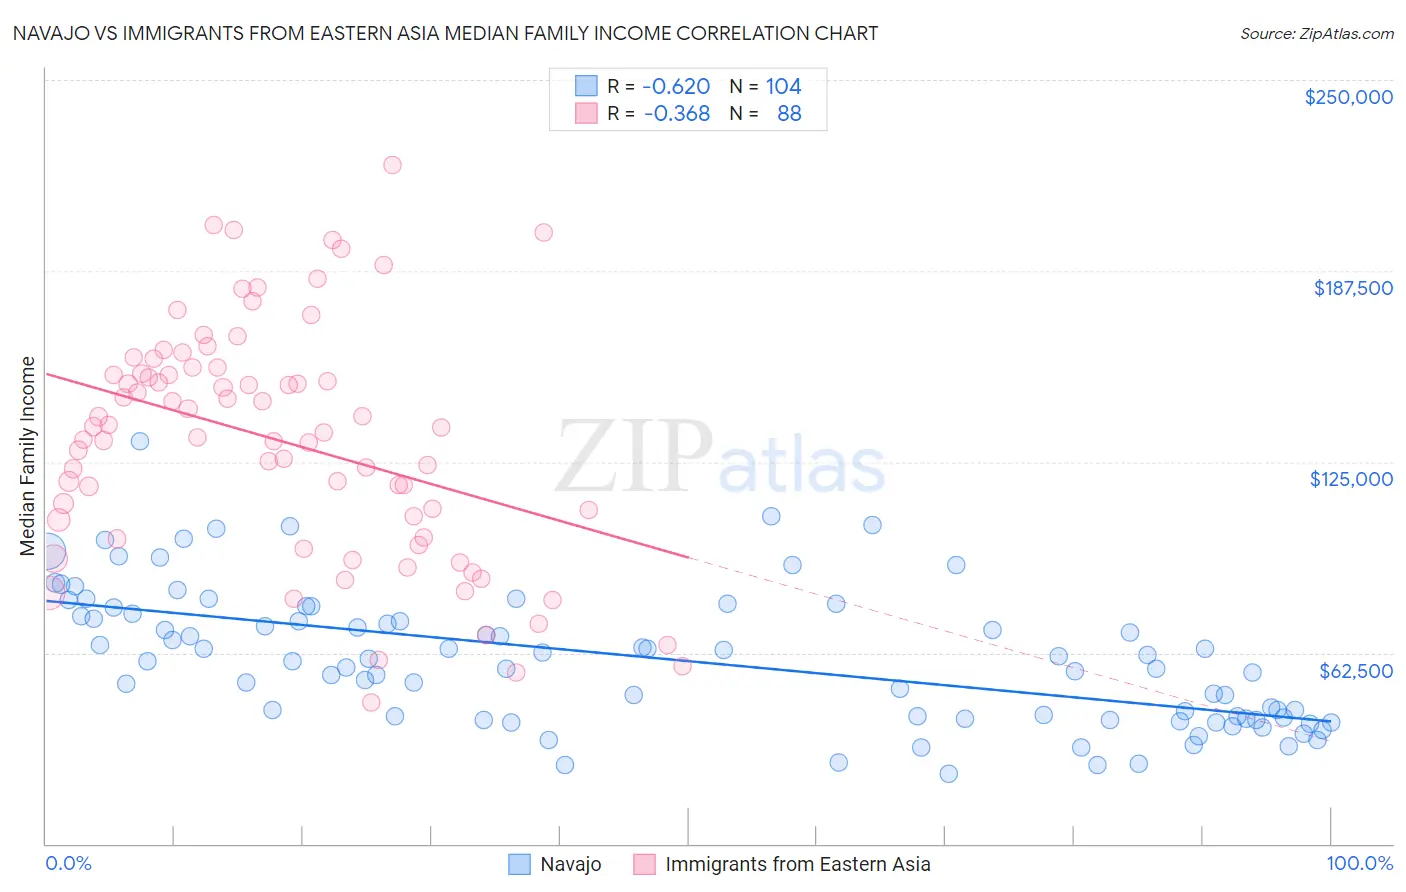
Navajo vs Immigrants from Eastern Asia Median Family Income Correlation Chart
The statistical analysis conducted on geographies consisting of 224,690,436 people shows a significant negative correlation between the proportion of Navajo and median family income in the United States with a correlation coefficient (R) of -0.620 and weighted average of $70,989. Similarly, the statistical analysis conducted on geographies consisting of 499,115,176 people shows a mild negative correlation between the proportion of Immigrants from Eastern Asia and median family income in the United States with a correlation coefficient (R) of -0.368 and weighted average of $125,150, a difference of 76.3%.
Median Family Income Correlation Summary
| Measurement | Navajo | Immigrants from Eastern Asia |
| Minimum | $22,955 | $46,207 |
| Maximum | $131,574 | $222,159 |
| Range | $108,619 | $175,952 |
| Mean | $60,376 | $131,947 |
| Median | $59,766 | $135,368 |
| Interquartile 25% (IQ1) | $41,038 | $103,059 |
| Interquartile 75% (IQ3) | $74,887 | $154,860 |
| Interquartile Range (IQR) | $33,849 | $51,801 |
| Standard Deviation (Sample) | $22,079 | $38,302 |
| Standard Deviation (Population) | $21,972 | $38,084 |
Similar Demographics by Median Family Income
Demographics Similar to Navajo by Median Family Income
In terms of median family income, the demographic groups most similar to Navajo are Puerto Rican ($70,423, a difference of 0.80%), Tohono O'odham ($72,193, a difference of 1.7%), Lumbee ($68,679, a difference of 3.4%), Houma ($76,188, a difference of 7.3%), and Crow ($76,605, a difference of 7.9%).
| Demographics | Rating | Rank | Median Family Income |
| Kiowa | 0.0 /100 | #333 | Tragic $80,885 |
| Menominee | 0.0 /100 | #334 | Tragic $79,563 |
| Yup'ik | 0.0 /100 | #335 | Tragic $79,290 |
| Immigrants | Cuba | 0.0 /100 | #336 | Tragic $78,249 |
| Yuman | 0.0 /100 | #337 | Tragic $78,055 |
| Immigrants | Yemen | 0.0 /100 | #338 | Tragic $77,457 |
| Pima | 0.0 /100 | #339 | Tragic $77,431 |
| Hopi | 0.0 /100 | #340 | Tragic $77,188 |
| Pueblo | 0.0 /100 | #341 | Tragic $76,880 |
| Crow | 0.0 /100 | #342 | Tragic $76,605 |
| Houma | 0.0 /100 | #343 | Tragic $76,188 |
| Tohono O'odham | 0.0 /100 | #344 | Tragic $72,193 |
| Navajo | 0.0 /100 | #345 | Tragic $70,989 |
| Puerto Ricans | 0.0 /100 | #346 | Tragic $70,423 |
| Lumbee | 0.0 /100 | #347 | Tragic $68,679 |
Demographics Similar to Immigrants from Eastern Asia by Median Family Income
In terms of median family income, the demographic groups most similar to Immigrants from Eastern Asia are Indian (Asian) ($125,312, a difference of 0.13%), Immigrants from China ($125,540, a difference of 0.31%), Eastern European ($125,546, a difference of 0.32%), Immigrants from South Central Asia ($125,956, a difference of 0.64%), and Immigrants from Belgium ($123,831, a difference of 1.1%).
| Demographics | Rating | Rank | Median Family Income |
| Immigrants | Israel | 100.0 /100 | #11 | Exceptional $127,430 |
| Cypriots | 100.0 /100 | #12 | Exceptional $127,064 |
| Immigrants | Australia | 100.0 /100 | #13 | Exceptional $126,620 |
| Immigrants | South Central Asia | 100.0 /100 | #14 | Exceptional $125,956 |
| Eastern Europeans | 100.0 /100 | #15 | Exceptional $125,546 |
| Immigrants | China | 100.0 /100 | #16 | Exceptional $125,540 |
| Indians (Asian) | 100.0 /100 | #17 | Exceptional $125,312 |
| Immigrants | Eastern Asia | 100.0 /100 | #18 | Exceptional $125,150 |
| Immigrants | Belgium | 100.0 /100 | #19 | Exceptional $123,831 |
| Burmese | 100.0 /100 | #20 | Exceptional $123,369 |
| Immigrants | Korea | 100.0 /100 | #21 | Exceptional $122,800 |
| Immigrants | Sweden | 100.0 /100 | #22 | Exceptional $122,765 |
| Immigrants | Japan | 100.0 /100 | #23 | Exceptional $122,764 |
| Immigrants | Northern Europe | 100.0 /100 | #24 | Exceptional $121,840 |
| Turks | 100.0 /100 | #25 | Exceptional $121,202 |