Navajo vs French Canadian Median Family Income
COMPARE
Navajo
French Canadian
Median Family Income
Median Family Income Comparison
Navajo
French Canadians
$70,989
MEDIAN FAMILY INCOME
0.0/ 100
METRIC RATING
345th/ 347
METRIC RANK
$101,634
MEDIAN FAMILY INCOME
37.0/ 100
METRIC RATING
180th/ 347
METRIC RANK
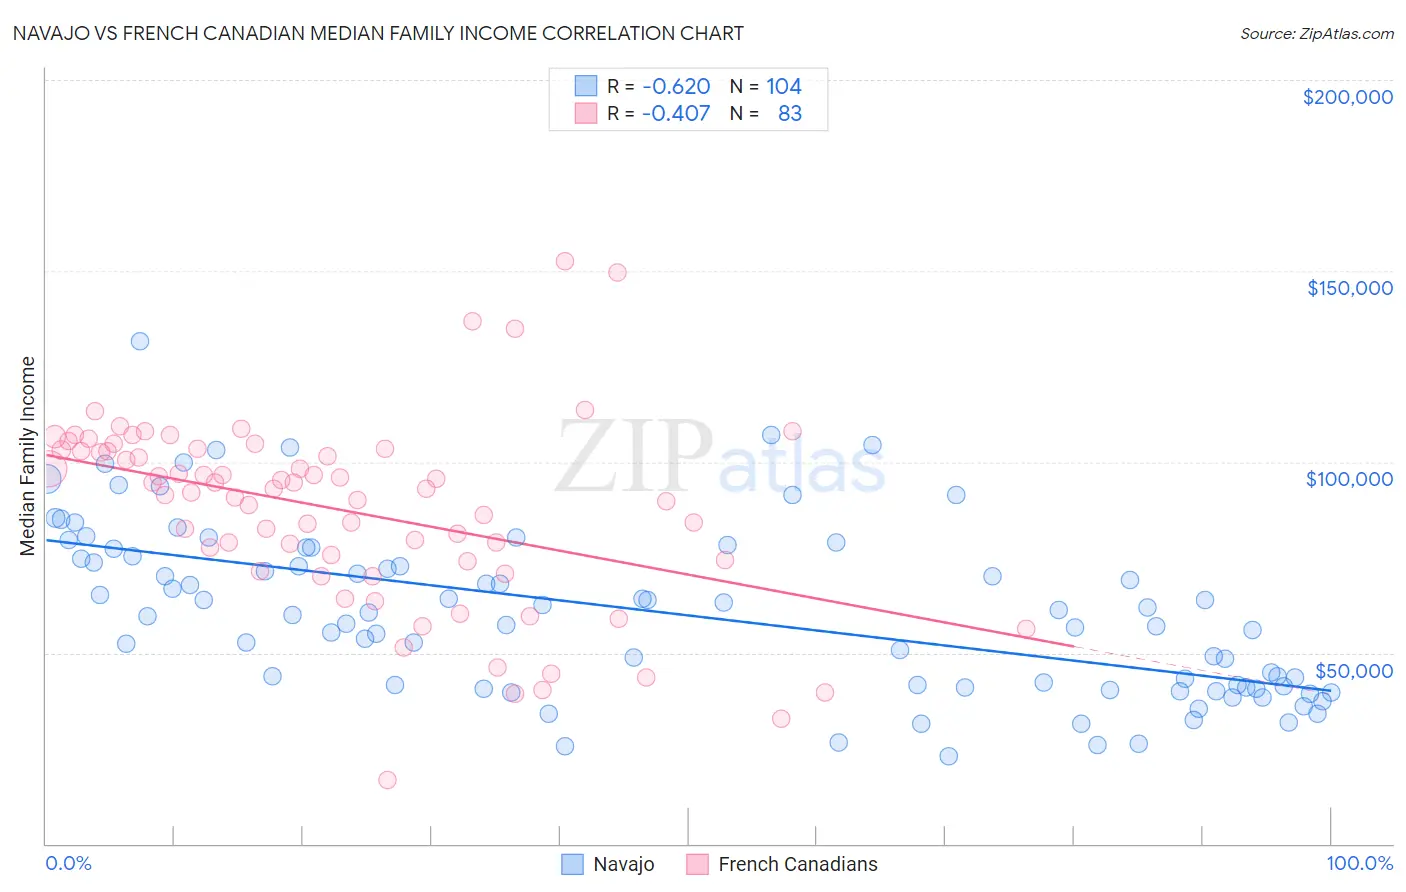
Navajo vs French Canadian Median Family Income Correlation Chart
The statistical analysis conducted on geographies consisting of 224,690,436 people shows a significant negative correlation between the proportion of Navajo and median family income in the United States with a correlation coefficient (R) of -0.620 and weighted average of $70,989. Similarly, the statistical analysis conducted on geographies consisting of 501,962,577 people shows a moderate negative correlation between the proportion of French Canadians and median family income in the United States with a correlation coefficient (R) of -0.407 and weighted average of $101,634, a difference of 43.2%.
Median Family Income Correlation Summary
| Measurement | Navajo | French Canadian |
| Minimum | $22,955 | $16,696 |
| Maximum | $131,574 | $152,574 |
| Range | $108,619 | $135,878 |
| Mean | $60,376 | $87,243 |
| Median | $59,766 | $92,910 |
| Interquartile 25% (IQ1) | $41,038 | $74,042 |
| Interquartile 75% (IQ3) | $74,887 | $103,222 |
| Interquartile Range (IQR) | $33,849 | $29,180 |
| Standard Deviation (Sample) | $22,079 | $24,938 |
| Standard Deviation (Population) | $21,972 | $24,788 |
Similar Demographics by Median Family Income
Demographics Similar to Navajo by Median Family Income
In terms of median family income, the demographic groups most similar to Navajo are Puerto Rican ($70,423, a difference of 0.80%), Tohono O'odham ($72,193, a difference of 1.7%), Lumbee ($68,679, a difference of 3.4%), Houma ($76,188, a difference of 7.3%), and Crow ($76,605, a difference of 7.9%).
| Demographics | Rating | Rank | Median Family Income |
| Kiowa | 0.0 /100 | #333 | Tragic $80,885 |
| Menominee | 0.0 /100 | #334 | Tragic $79,563 |
| Yup'ik | 0.0 /100 | #335 | Tragic $79,290 |
| Immigrants | Cuba | 0.0 /100 | #336 | Tragic $78,249 |
| Yuman | 0.0 /100 | #337 | Tragic $78,055 |
| Immigrants | Yemen | 0.0 /100 | #338 | Tragic $77,457 |
| Pima | 0.0 /100 | #339 | Tragic $77,431 |
| Hopi | 0.0 /100 | #340 | Tragic $77,188 |
| Pueblo | 0.0 /100 | #341 | Tragic $76,880 |
| Crow | 0.0 /100 | #342 | Tragic $76,605 |
| Houma | 0.0 /100 | #343 | Tragic $76,188 |
| Tohono O'odham | 0.0 /100 | #344 | Tragic $72,193 |
| Navajo | 0.0 /100 | #345 | Tragic $70,989 |
| Puerto Ricans | 0.0 /100 | #346 | Tragic $70,423 |
| Lumbee | 0.0 /100 | #347 | Tragic $68,679 |
Demographics Similar to French Canadians by Median Family Income
In terms of median family income, the demographic groups most similar to French Canadians are Spaniard ($101,617, a difference of 0.020%), Tsimshian ($101,543, a difference of 0.090%), Kenyan ($101,417, a difference of 0.21%), South American ($101,856, a difference of 0.22%), and Immigrants from Costa Rica ($101,354, a difference of 0.28%).
| Demographics | Rating | Rank | Median Family Income |
| Belgians | 51.4 /100 | #173 | Average $102,788 |
| Finns | 50.0 /100 | #174 | Average $102,676 |
| Immigrants | Eastern Africa | 47.1 /100 | #175 | Average $102,451 |
| French | 46.1 /100 | #176 | Average $102,368 |
| Germans | 44.6 /100 | #177 | Average $102,254 |
| Welsh | 43.3 /100 | #178 | Average $102,151 |
| South Americans | 39.7 /100 | #179 | Fair $101,856 |
| French Canadians | 37.0 /100 | #180 | Fair $101,634 |
| Spaniards | 36.8 /100 | #181 | Fair $101,617 |
| Tsimshian | 35.9 /100 | #182 | Fair $101,543 |
| Kenyans | 34.5 /100 | #183 | Fair $101,417 |
| Immigrants | Costa Rica | 33.7 /100 | #184 | Fair $101,354 |
| Dutch | 31.9 /100 | #185 | Fair $101,192 |
| Celtics | 31.3 /100 | #186 | Fair $101,139 |
| Tlingit-Haida | 30.8 /100 | #187 | Fair $101,092 |