Navajo vs Immigrants from Asia Median Earnings
COMPARE
Navajo
Immigrants from Asia
Median Earnings
Median Earnings Comparison
Navajo
Immigrants from Asia
$36,999
MEDIAN EARNINGS
0.0/ 100
METRIC RATING
340th/ 347
METRIC RANK
$53,310
MEDIAN EARNINGS
100.0/ 100
METRIC RATING
32nd/ 347
METRIC RANK
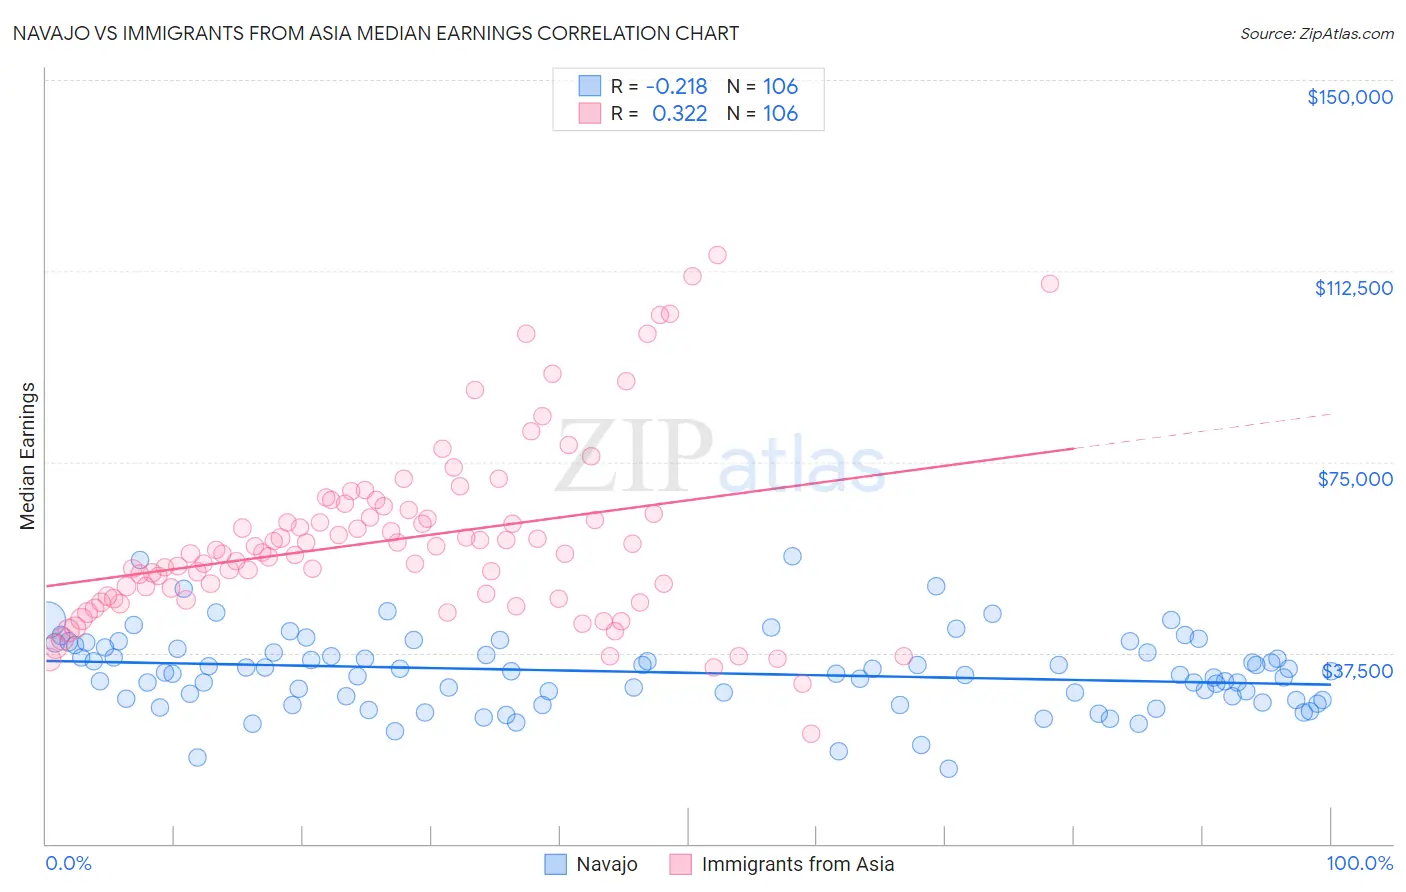
Navajo vs Immigrants from Asia Median Earnings Correlation Chart
The statistical analysis conducted on geographies consisting of 224,830,448 people shows a weak negative correlation between the proportion of Navajo and median earnings in the United States with a correlation coefficient (R) of -0.218 and weighted average of $36,999. Similarly, the statistical analysis conducted on geographies consisting of 549,053,293 people shows a mild positive correlation between the proportion of Immigrants from Asia and median earnings in the United States with a correlation coefficient (R) of 0.322 and weighted average of $53,310, a difference of 44.1%.
Median Earnings Correlation Summary
| Measurement | Navajo | Immigrants from Asia |
| Minimum | $14,775 | $21,667 |
| Maximum | $56,536 | $115,585 |
| Range | $41,761 | $93,918 |
| Mean | $33,645 | $59,791 |
| Median | $33,604 | $57,103 |
| Interquartile 25% (IQ1) | $28,471 | $48,160 |
| Interquartile 75% (IQ3) | $38,362 | $65,665 |
| Interquartile Range (IQR) | $9,890 | $17,505 |
| Standard Deviation (Sample) | $7,461 | $17,673 |
| Standard Deviation (Population) | $7,426 | $17,589 |
Similar Demographics by Median Earnings
Demographics Similar to Navajo by Median Earnings
In terms of median earnings, the demographic groups most similar to Navajo are Lumbee ($36,876, a difference of 0.33%), Hopi ($36,871, a difference of 0.35%), Pueblo ($36,859, a difference of 0.38%), Arapaho ($36,586, a difference of 1.1%), and Tohono O'odham ($36,349, a difference of 1.8%).
| Demographics | Rating | Rank | Median Earnings |
| Houma | 0.0 /100 | #333 | Tragic $38,949 |
| Spanish American Indians | 0.0 /100 | #334 | Tragic $38,907 |
| Natives/Alaskans | 0.0 /100 | #335 | Tragic $38,896 |
| Crow | 0.0 /100 | #336 | Tragic $38,707 |
| Immigrants | Cuba | 0.0 /100 | #337 | Tragic $38,426 |
| Pima | 0.0 /100 | #338 | Tragic $38,285 |
| Menominee | 0.0 /100 | #339 | Tragic $37,884 |
| Navajo | 0.0 /100 | #340 | Tragic $36,999 |
| Lumbee | 0.0 /100 | #341 | Tragic $36,876 |
| Hopi | 0.0 /100 | #342 | Tragic $36,871 |
| Pueblo | 0.0 /100 | #343 | Tragic $36,859 |
| Arapaho | 0.0 /100 | #344 | Tragic $36,586 |
| Tohono O'odham | 0.0 /100 | #345 | Tragic $36,349 |
| Yup'ik | 0.0 /100 | #346 | Tragic $35,942 |
| Puerto Ricans | 0.0 /100 | #347 | Tragic $35,560 |
Demographics Similar to Immigrants from Asia by Median Earnings
In terms of median earnings, the demographic groups most similar to Immigrants from Asia are Russian ($53,334, a difference of 0.040%), Immigrants from Greece ($53,282, a difference of 0.050%), Immigrants from Sri Lanka ($53,268, a difference of 0.080%), Cambodian ($53,386, a difference of 0.14%), and Immigrants from Switzerland ($53,211, a difference of 0.19%).
| Demographics | Rating | Rank | Median Earnings |
| Turks | 100.0 /100 | #25 | Exceptional $53,919 |
| Immigrants | Northern Europe | 100.0 /100 | #26 | Exceptional $53,872 |
| Asians | 100.0 /100 | #27 | Exceptional $53,690 |
| Immigrants | France | 100.0 /100 | #28 | Exceptional $53,490 |
| Immigrants | Russia | 100.0 /100 | #29 | Exceptional $53,457 |
| Cambodians | 100.0 /100 | #30 | Exceptional $53,386 |
| Russians | 100.0 /100 | #31 | Exceptional $53,334 |
| Immigrants | Asia | 100.0 /100 | #32 | Exceptional $53,310 |
| Immigrants | Greece | 100.0 /100 | #33 | Exceptional $53,282 |
| Immigrants | Sri Lanka | 100.0 /100 | #34 | Exceptional $53,268 |
| Immigrants | Switzerland | 100.0 /100 | #35 | Exceptional $53,211 |
| Immigrants | Denmark | 100.0 /100 | #36 | Exceptional $53,186 |
| Immigrants | Belarus | 100.0 /100 | #37 | Exceptional $53,043 |
| Latvians | 100.0 /100 | #38 | Exceptional $53,001 |
| Immigrants | Turkey | 100.0 /100 | #39 | Exceptional $52,960 |