Immigrants from Europe vs Immigrants from Bulgaria Median Household Income
COMPARE
Immigrants from Europe
Immigrants from Bulgaria
Median Household Income
Median Household Income Comparison
Immigrants from Europe
Immigrants from Bulgaria
$95,032
MEDIAN HOUSEHOLD INCOME
99.8/ 100
METRIC RATING
59th/ 347
METRIC RANK
$93,148
MEDIAN HOUSEHOLD INCOME
99.4/ 100
METRIC RATING
78th/ 347
METRIC RANK
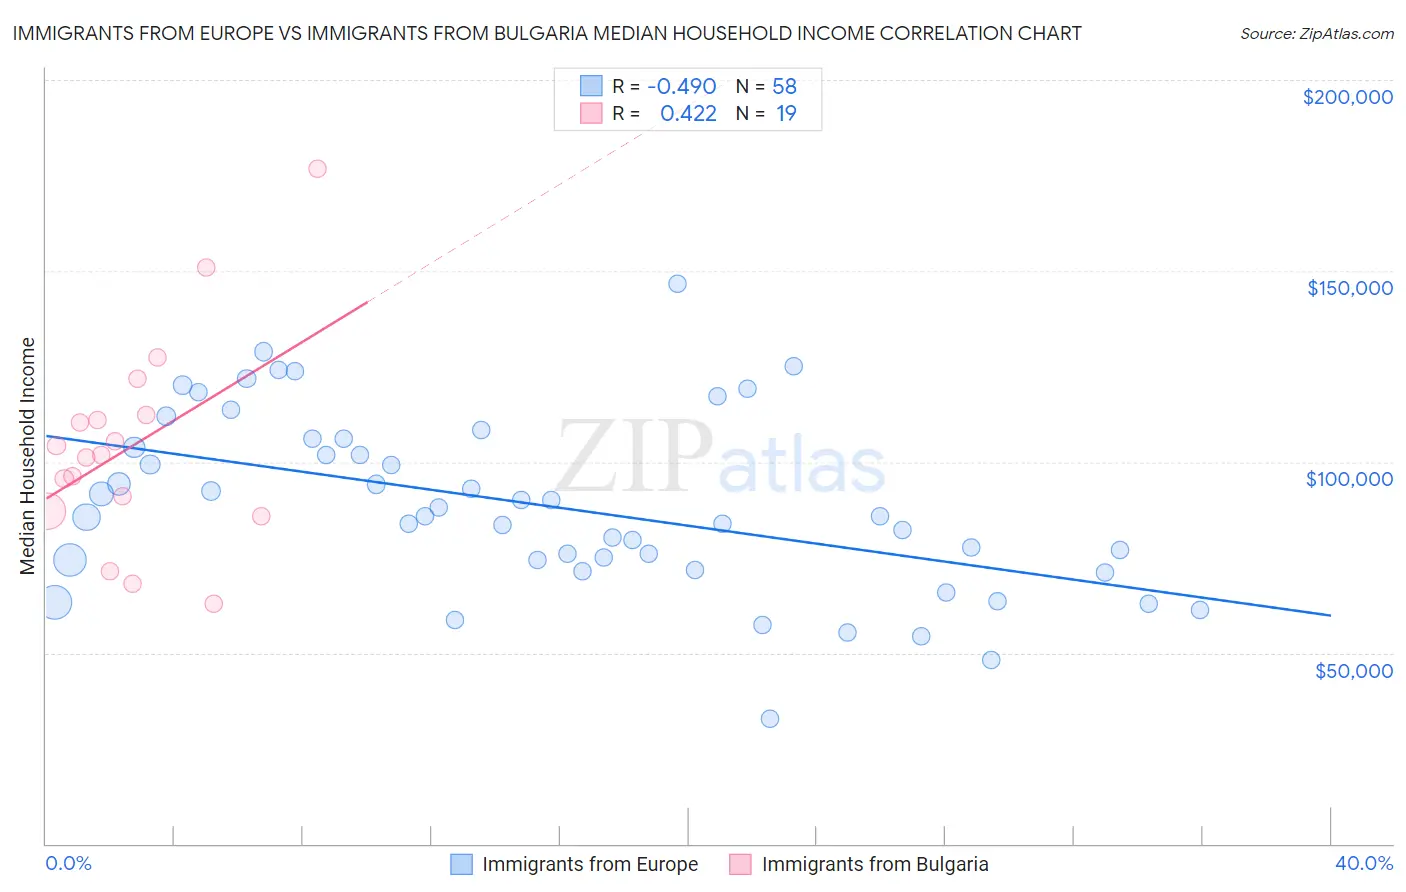
Immigrants from Europe vs Immigrants from Bulgaria Median Household Income Correlation Chart
The statistical analysis conducted on geographies consisting of 546,586,899 people shows a moderate negative correlation between the proportion of Immigrants from Europe and median household income in the United States with a correlation coefficient (R) of -0.490 and weighted average of $95,032. Similarly, the statistical analysis conducted on geographies consisting of 172,532,880 people shows a moderate positive correlation between the proportion of Immigrants from Bulgaria and median household income in the United States with a correlation coefficient (R) of 0.422 and weighted average of $93,148, a difference of 2.0%.
Median Household Income Correlation Summary
| Measurement | Immigrants from Europe | Immigrants from Bulgaria |
| Minimum | $32,853 | $62,888 |
| Maximum | $146,675 | $176,736 |
| Range | $113,822 | $113,848 |
| Mean | $88,761 | $104,276 |
| Median | $85,626 | $101,764 |
| Interquartile 25% (IQ1) | $74,349 | $87,129 |
| Interquartile 75% (IQ3) | $105,928 | $112,416 |
| Interquartile Range (IQR) | $31,579 | $25,288 |
| Standard Deviation (Sample) | $23,344 | $27,381 |
| Standard Deviation (Population) | $23,142 | $26,651 |
Demographics Similar to Immigrants from Europe and Immigrants from Bulgaria by Median Household Income
In terms of median household income, the demographic groups most similar to Immigrants from Europe are Korean ($95,018, a difference of 0.020%), Laotian ($94,990, a difference of 0.040%), Soviet Union ($95,098, a difference of 0.070%), Immigrants from Norway ($94,846, a difference of 0.20%), and Greek ($94,735, a difference of 0.31%). Similarly, the demographic groups most similar to Immigrants from Bulgaria are Immigrants from Afghanistan ($93,375, a difference of 0.24%), South African ($93,379, a difference of 0.25%), Immigrants from Italy ($93,465, a difference of 0.34%), Immigrants from Latvia ($93,602, a difference of 0.49%), and Immigrants from Egypt ($93,700, a difference of 0.59%).
| Demographics | Rating | Rank | Median Household Income |
| Soviet Union | 99.8 /100 | #58 | Exceptional $95,098 |
| Immigrants | Europe | 99.8 /100 | #59 | Exceptional $95,032 |
| Koreans | 99.8 /100 | #60 | Exceptional $95,018 |
| Laotians | 99.8 /100 | #61 | Exceptional $94,990 |
| Immigrants | Norway | 99.8 /100 | #62 | Exceptional $94,846 |
| Greeks | 99.8 /100 | #63 | Exceptional $94,735 |
| Immigrants | Netherlands | 99.7 /100 | #64 | Exceptional $94,411 |
| Immigrants | Belarus | 99.7 /100 | #65 | Exceptional $94,399 |
| Immigrants | Romania | 99.7 /100 | #66 | Exceptional $94,222 |
| Immigrants | Scotland | 99.7 /100 | #67 | Exceptional $94,091 |
| Mongolians | 99.7 /100 | #68 | Exceptional $93,971 |
| Argentineans | 99.7 /100 | #69 | Exceptional $93,960 |
| Immigrants | Fiji | 99.7 /100 | #70 | Exceptional $93,933 |
| Immigrants | Philippines | 99.6 /100 | #71 | Exceptional $93,899 |
| Lithuanians | 99.6 /100 | #72 | Exceptional $93,852 |
| Immigrants | Egypt | 99.6 /100 | #73 | Exceptional $93,700 |
| Immigrants | Latvia | 99.6 /100 | #74 | Exceptional $93,602 |
| Immigrants | Italy | 99.5 /100 | #75 | Exceptional $93,465 |
| South Africans | 99.5 /100 | #76 | Exceptional $93,379 |
| Immigrants | Afghanistan | 99.5 /100 | #77 | Exceptional $93,375 |
| Immigrants | Bulgaria | 99.4 /100 | #78 | Exceptional $93,148 |