Navajo vs Immigrants from Bulgaria 6th Grade
COMPARE
Navajo
Immigrants from Bulgaria
6th Grade
6th Grade Comparison
Navajo
Immigrants from Bulgaria
96.8%
6TH GRADE
7.3/ 100
METRIC RATING
218th/ 347
METRIC RANK
97.3%
6TH GRADE
93.6/ 100
METRIC RATING
126th/ 347
METRIC RANK
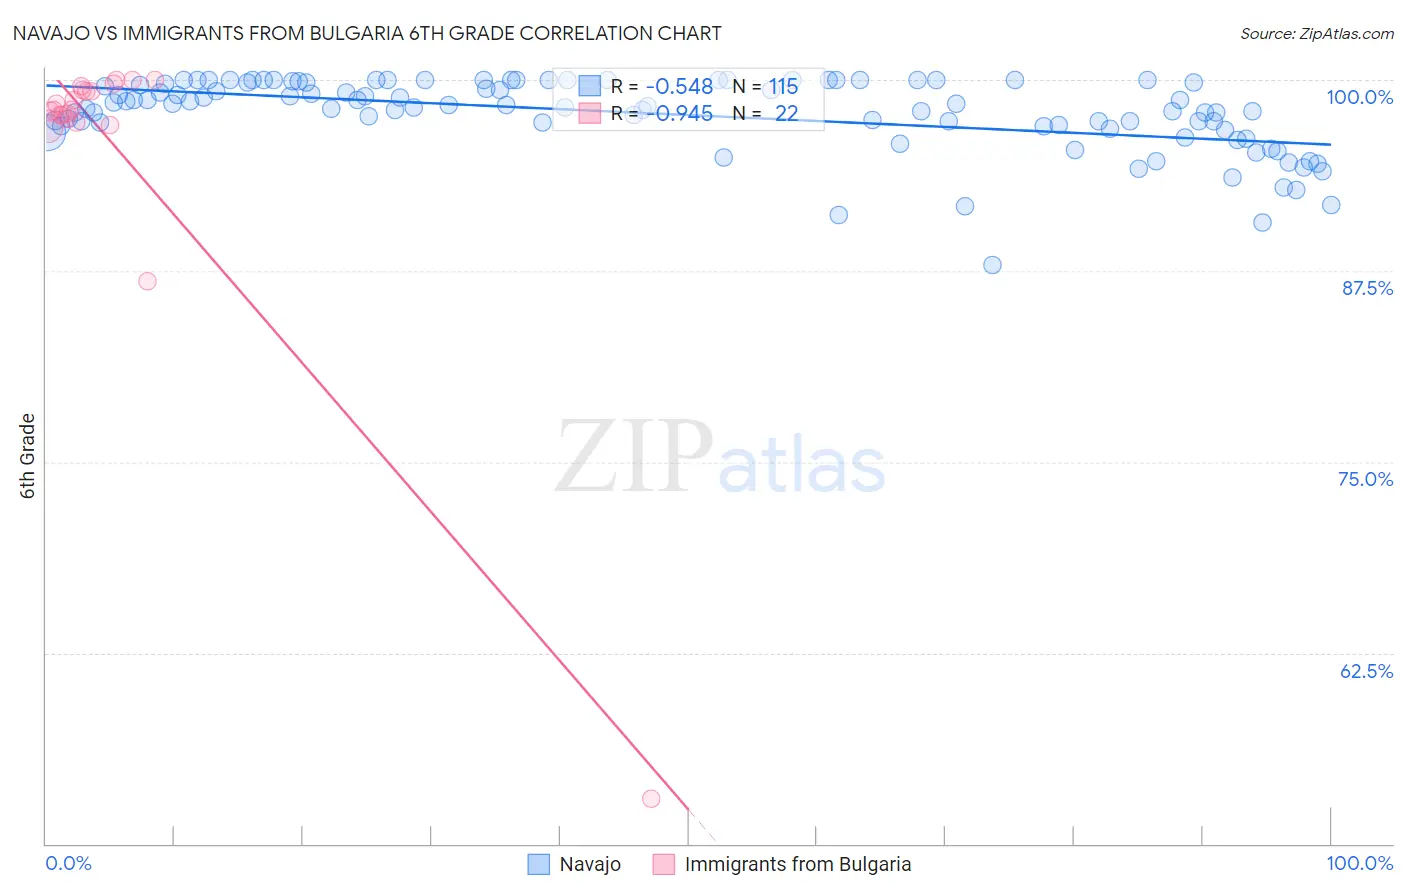
Navajo vs Immigrants from Bulgaria 6th Grade Correlation Chart
The statistical analysis conducted on geographies consisting of 224,872,927 people shows a substantial negative correlation between the proportion of Navajo and percentage of population with at least 6th grade education in the United States with a correlation coefficient (R) of -0.548 and weighted average of 96.8%. Similarly, the statistical analysis conducted on geographies consisting of 172,552,181 people shows a near-perfect negative correlation between the proportion of Immigrants from Bulgaria and percentage of population with at least 6th grade education in the United States with a correlation coefficient (R) of -0.945 and weighted average of 97.3%, a difference of 0.60%.
6th Grade Correlation Summary
| Measurement | Navajo | Immigrants from Bulgaria |
| Minimum | 87.9% | 52.9% |
| Maximum | 100.0% | 100.0% |
| Range | 12.1% | 47.1% |
| Mean | 97.8% | 95.9% |
| Median | 98.3% | 98.0% |
| Interquartile 25% (IQ1) | 97.0% | 97.5% |
| Interquartile 75% (IQ3) | 99.9% | 99.4% |
| Interquartile Range (IQR) | 2.9% | 1.9% |
| Standard Deviation (Sample) | 2.4% | 10.0% |
| Standard Deviation (Population) | 2.4% | 9.7% |
Similar Demographics by 6th Grade
Demographics Similar to Navajo by 6th Grade
In terms of 6th grade, the demographic groups most similar to Navajo are Liberian (96.8%, a difference of 0.0%), Sierra Leonean (96.8%, a difference of 0.010%), Paiute (96.8%, a difference of 0.010%), Costa Rican (96.8%, a difference of 0.010%), and Immigrants from Sudan (96.8%, a difference of 0.020%).
| Demographics | Rating | Rank | 6th Grade |
| Immigrants | Iraq | 9.2 /100 | #211 | Tragic 96.8% |
| Moroccans | 9.0 /100 | #212 | Tragic 96.8% |
| Immigrants | Sudan | 8.7 /100 | #213 | Tragic 96.8% |
| Portuguese | 8.2 /100 | #214 | Tragic 96.8% |
| Sierra Leoneans | 8.0 /100 | #215 | Tragic 96.8% |
| Paiute | 7.8 /100 | #216 | Tragic 96.8% |
| Liberians | 7.5 /100 | #217 | Tragic 96.8% |
| Navajo | 7.3 /100 | #218 | Tragic 96.8% |
| Costa Ricans | 6.8 /100 | #219 | Tragic 96.8% |
| Immigrants | Morocco | 6.2 /100 | #220 | Tragic 96.7% |
| Tongans | 6.1 /100 | #221 | Tragic 96.7% |
| Immigrants | Syria | 5.9 /100 | #222 | Tragic 96.7% |
| Bahamians | 4.8 /100 | #223 | Tragic 96.7% |
| Immigrants | Southern Europe | 4.4 /100 | #224 | Tragic 96.7% |
| Immigrants | Pakistan | 4.4 /100 | #225 | Tragic 96.7% |
Demographics Similar to Immigrants from Bulgaria by 6th Grade
In terms of 6th grade, the demographic groups most similar to Immigrants from Bulgaria are Spanish (97.3%, a difference of 0.0%), Okinawan (97.4%, a difference of 0.010%), Immigrants from Croatia (97.3%, a difference of 0.010%), Immigrants from Norway (97.4%, a difference of 0.020%), and Immigrants from France (97.4%, a difference of 0.020%).
| Demographics | Rating | Rank | 6th Grade |
| Immigrants | Zimbabwe | 95.0 /100 | #119 | Exceptional 97.4% |
| Syrians | 94.8 /100 | #120 | Exceptional 97.4% |
| Immigrants | Norway | 94.7 /100 | #121 | Exceptional 97.4% |
| Immigrants | France | 94.5 /100 | #122 | Exceptional 97.4% |
| Hmong | 94.4 /100 | #123 | Exceptional 97.4% |
| Okinawans | 94.2 /100 | #124 | Exceptional 97.4% |
| Spanish | 93.7 /100 | #125 | Exceptional 97.3% |
| Immigrants | Bulgaria | 93.6 /100 | #126 | Exceptional 97.3% |
| Immigrants | Croatia | 93.1 /100 | #127 | Exceptional 97.3% |
| Immigrants | Romania | 92.0 /100 | #128 | Exceptional 97.3% |
| Immigrants | Serbia | 91.9 /100 | #129 | Exceptional 97.3% |
| Cambodians | 91.8 /100 | #130 | Exceptional 97.3% |
| Immigrants | Europe | 91.1 /100 | #131 | Exceptional 97.3% |
| Palestinians | 90.9 /100 | #132 | Exceptional 97.3% |
| Immigrants | Moldova | 90.0 /100 | #133 | Excellent 97.3% |