Subsaharan African vs Immigrants from Bulgaria Median Household Income
COMPARE
Subsaharan African
Immigrants from Bulgaria
Median Household Income
Median Household Income Comparison
Sub-Saharan Africans
Immigrants from Bulgaria
$77,631
MEDIAN HOUSEHOLD INCOME
0.8/ 100
METRIC RATING
254th/ 347
METRIC RANK
$93,148
MEDIAN HOUSEHOLD INCOME
99.4/ 100
METRIC RATING
78th/ 347
METRIC RANK
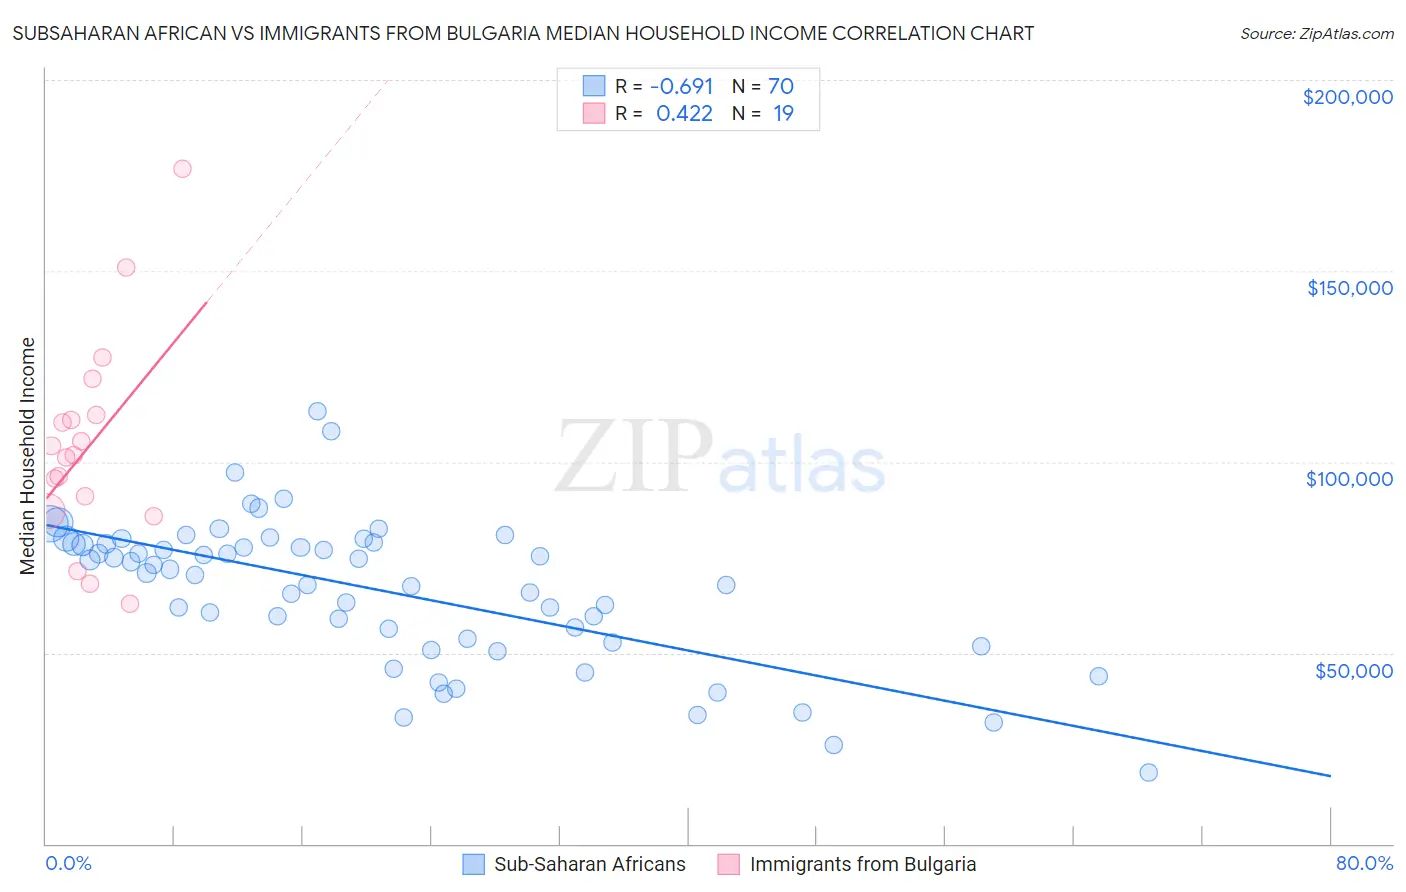
Subsaharan African vs Immigrants from Bulgaria Median Household Income Correlation Chart
The statistical analysis conducted on geographies consisting of 507,380,534 people shows a significant negative correlation between the proportion of Sub-Saharan Africans and median household income in the United States with a correlation coefficient (R) of -0.691 and weighted average of $77,631. Similarly, the statistical analysis conducted on geographies consisting of 172,532,880 people shows a moderate positive correlation between the proportion of Immigrants from Bulgaria and median household income in the United States with a correlation coefficient (R) of 0.422 and weighted average of $93,148, a difference of 20.0%.
Median Household Income Correlation Summary
| Measurement | Subsaharan African | Immigrants from Bulgaria |
| Minimum | $18,750 | $62,888 |
| Maximum | $113,418 | $176,736 |
| Range | $94,668 | $113,848 |
| Mean | $66,483 | $104,276 |
| Median | $71,386 | $101,764 |
| Interquartile 25% (IQ1) | $53,589 | $87,129 |
| Interquartile 75% (IQ3) | $78,576 | $112,416 |
| Interquartile Range (IQR) | $24,988 | $25,288 |
| Standard Deviation (Sample) | $18,848 | $27,381 |
| Standard Deviation (Population) | $18,713 | $26,651 |
Similar Demographics by Median Household Income
Demographics Similar to Sub-Saharan Africans by Median Household Income
In terms of median household income, the demographic groups most similar to Sub-Saharan Africans are Immigrants from St. Vincent and the Grenadines ($77,690, a difference of 0.080%), Immigrants from Middle Africa ($77,559, a difference of 0.090%), Immigrants from West Indies ($77,956, a difference of 0.42%), Mexican American Indian ($78,166, a difference of 0.69%), and Belizean ($77,028, a difference of 0.78%).
| Demographics | Rating | Rank | Median Household Income |
| Immigrants | Burma/Myanmar | 1.6 /100 | #247 | Tragic $78,682 |
| Sudanese | 1.5 /100 | #248 | Tragic $78,529 |
| West Indians | 1.4 /100 | #249 | Tragic $78,455 |
| Immigrants | Laos | 1.3 /100 | #250 | Tragic $78,327 |
| Mexican American Indians | 1.2 /100 | #251 | Tragic $78,166 |
| Immigrants | West Indies | 1.0 /100 | #252 | Tragic $77,956 |
| Immigrants | St. Vincent and the Grenadines | 0.9 /100 | #253 | Tragic $77,690 |
| Sub-Saharan Africans | 0.8 /100 | #254 | Tragic $77,631 |
| Immigrants | Middle Africa | 0.8 /100 | #255 | Tragic $77,559 |
| Belizeans | 0.6 /100 | #256 | Tragic $77,028 |
| Immigrants | Senegal | 0.5 /100 | #257 | Tragic $76,915 |
| Immigrants | Nicaragua | 0.5 /100 | #258 | Tragic $76,784 |
| Spanish American Indians | 0.4 /100 | #259 | Tragic $76,670 |
| Jamaicans | 0.4 /100 | #260 | Tragic $76,583 |
| Immigrants | Grenada | 0.4 /100 | #261 | Tragic $76,517 |
Demographics Similar to Immigrants from Bulgaria by Median Household Income
In terms of median household income, the demographic groups most similar to Immigrants from Bulgaria are Sri Lankan ($93,093, a difference of 0.060%), Tongan ($93,076, a difference of 0.080%), Immigrants from Eastern Europe ($93,051, a difference of 0.10%), Immigrants from Afghanistan ($93,375, a difference of 0.24%), and South African ($93,379, a difference of 0.25%).
| Demographics | Rating | Rank | Median Household Income |
| Immigrants | Philippines | 99.6 /100 | #71 | Exceptional $93,899 |
| Lithuanians | 99.6 /100 | #72 | Exceptional $93,852 |
| Immigrants | Egypt | 99.6 /100 | #73 | Exceptional $93,700 |
| Immigrants | Latvia | 99.6 /100 | #74 | Exceptional $93,602 |
| Immigrants | Italy | 99.5 /100 | #75 | Exceptional $93,465 |
| South Africans | 99.5 /100 | #76 | Exceptional $93,379 |
| Immigrants | Afghanistan | 99.5 /100 | #77 | Exceptional $93,375 |
| Immigrants | Bulgaria | 99.4 /100 | #78 | Exceptional $93,148 |
| Sri Lankans | 99.4 /100 | #79 | Exceptional $93,093 |
| Tongans | 99.4 /100 | #80 | Exceptional $93,076 |
| Immigrants | Eastern Europe | 99.4 /100 | #81 | Exceptional $93,051 |
| Immigrants | Spain | 99.3 /100 | #82 | Exceptional $92,732 |
| Italians | 99.1 /100 | #83 | Exceptional $92,475 |
| Immigrants | Argentina | 99.1 /100 | #84 | Exceptional $92,417 |
| Immigrants | Croatia | 99.0 /100 | #85 | Exceptional $92,225 |