Native/Alaskan vs Immigrants from Australia Median Female Earnings
COMPARE
Native/Alaskan
Immigrants from Australia
Median Female Earnings
Median Female Earnings Comparison
Natives/Alaskans
Immigrants from Australia
$33,806
MEDIAN FEMALE EARNINGS
0.0/ 100
METRIC RATING
331st/ 347
METRIC RANK
$46,573
MEDIAN FEMALE EARNINGS
100.0/ 100
METRIC RATING
13th/ 347
METRIC RANK
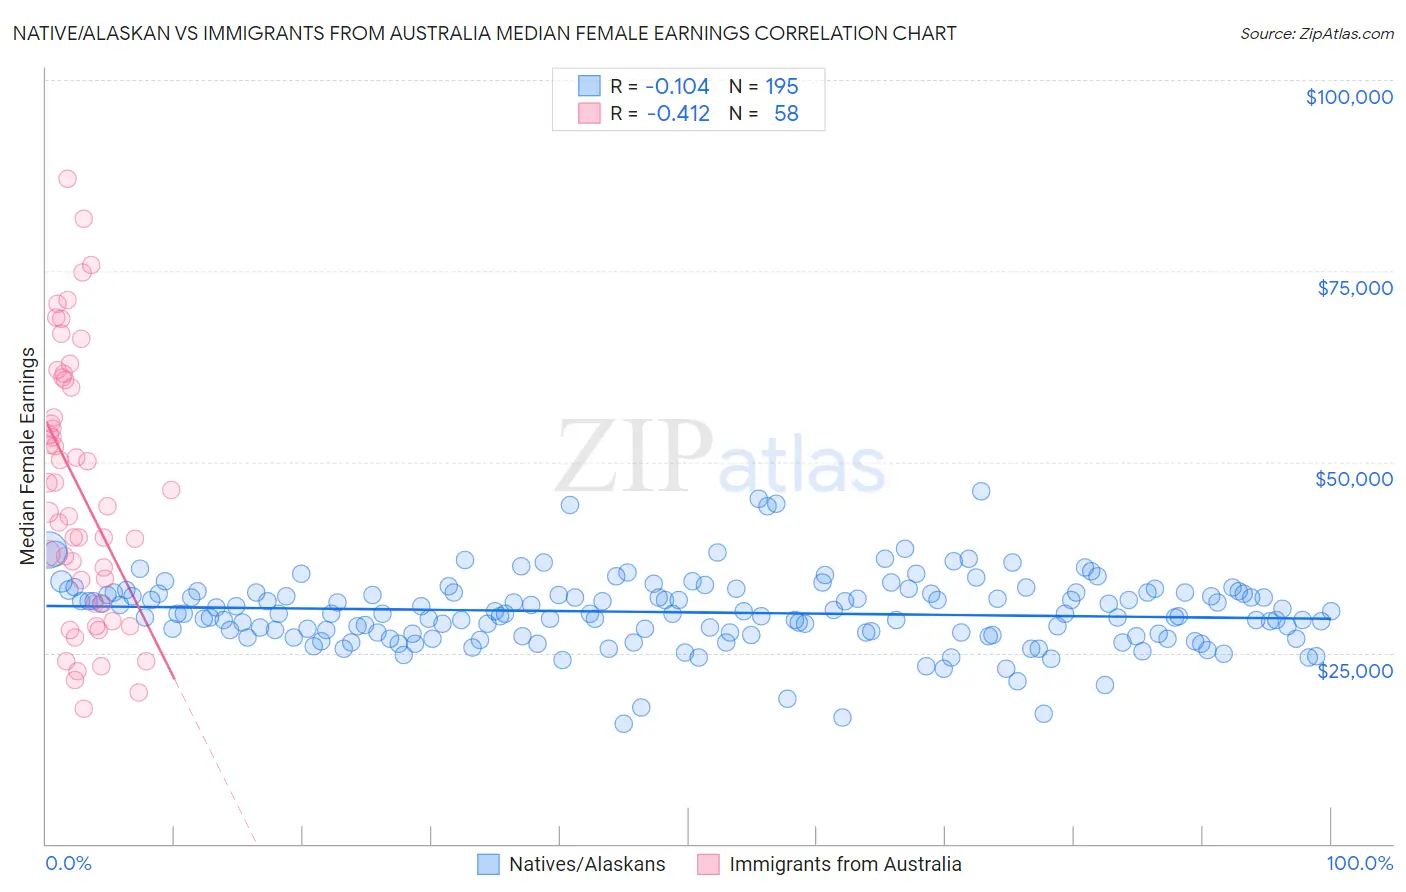
Native/Alaskan vs Immigrants from Australia Median Female Earnings Correlation Chart
The statistical analysis conducted on geographies consisting of 512,112,793 people shows a poor negative correlation between the proportion of Natives/Alaskans and median female earnings in the United States with a correlation coefficient (R) of -0.104 and weighted average of $33,806. Similarly, the statistical analysis conducted on geographies consisting of 227,158,397 people shows a moderate negative correlation between the proportion of Immigrants from Australia and median female earnings in the United States with a correlation coefficient (R) of -0.412 and weighted average of $46,573, a difference of 37.8%.
Median Female Earnings Correlation Summary
| Measurement | Native/Alaskan | Immigrants from Australia |
| Minimum | $15,696 | $17,627 |
| Maximum | $46,195 | $87,039 |
| Range | $30,499 | $69,412 |
| Mean | $30,297 | $46,604 |
| Median | $30,121 | $45,208 |
| Interquartile 25% (IQ1) | $27,399 | $31,477 |
| Interquartile 75% (IQ3) | $32,868 | $60,732 |
| Interquartile Range (IQR) | $5,469 | $29,255 |
| Standard Deviation (Sample) | $4,739 | $17,219 |
| Standard Deviation (Population) | $4,727 | $17,070 |
Similar Demographics by Median Female Earnings
Demographics Similar to Natives/Alaskans by Median Female Earnings
In terms of median female earnings, the demographic groups most similar to Natives/Alaskans are Choctaw ($33,775, a difference of 0.090%), Menominee ($33,894, a difference of 0.26%), Hopi ($33,932, a difference of 0.37%), Mexican ($33,664, a difference of 0.42%), and Immigrants from Central America ($33,953, a difference of 0.43%).
| Demographics | Rating | Rank | Median Female Earnings |
| Immigrants | Congo | 0.0 /100 | #324 | Tragic $34,317 |
| Dutch West Indians | 0.0 /100 | #325 | Tragic $34,106 |
| Kiowa | 0.0 /100 | #326 | Tragic $34,074 |
| Cajuns | 0.0 /100 | #327 | Tragic $34,034 |
| Immigrants | Central America | 0.0 /100 | #328 | Tragic $33,953 |
| Hopi | 0.0 /100 | #329 | Tragic $33,932 |
| Menominee | 0.0 /100 | #330 | Tragic $33,894 |
| Natives/Alaskans | 0.0 /100 | #331 | Tragic $33,806 |
| Choctaw | 0.0 /100 | #332 | Tragic $33,775 |
| Mexicans | 0.0 /100 | #333 | Tragic $33,664 |
| Spanish American Indians | 0.0 /100 | #334 | Tragic $33,625 |
| Creek | 0.0 /100 | #335 | Tragic $33,437 |
| Ottawa | 0.0 /100 | #336 | Tragic $33,378 |
| Yakama | 0.0 /100 | #337 | Tragic $33,354 |
| Immigrants | Cuba | 0.0 /100 | #338 | Tragic $33,291 |
Demographics Similar to Immigrants from Australia by Median Female Earnings
In terms of median female earnings, the demographic groups most similar to Immigrants from Australia are Soviet Union ($46,556, a difference of 0.040%), Immigrants from Eastern Asia ($46,502, a difference of 0.15%), Indian (Asian) ($46,481, a difference of 0.20%), Immigrants from South Central Asia ($46,324, a difference of 0.54%), and Okinawan ($46,905, a difference of 0.71%).
| Demographics | Rating | Rank | Median Female Earnings |
| Immigrants | Ireland | 100.0 /100 | #6 | Exceptional $47,598 |
| Thais | 100.0 /100 | #7 | Exceptional $47,577 |
| Iranians | 100.0 /100 | #8 | Exceptional $47,421 |
| Immigrants | Iran | 100.0 /100 | #9 | Exceptional $47,154 |
| Immigrants | China | 100.0 /100 | #10 | Exceptional $46,972 |
| Okinawans | 100.0 /100 | #11 | Exceptional $46,905 |
| Immigrants | Israel | 100.0 /100 | #12 | Exceptional $46,902 |
| Immigrants | Australia | 100.0 /100 | #13 | Exceptional $46,573 |
| Soviet Union | 100.0 /100 | #14 | Exceptional $46,556 |
| Immigrants | Eastern Asia | 100.0 /100 | #15 | Exceptional $46,502 |
| Indians (Asian) | 100.0 /100 | #16 | Exceptional $46,481 |
| Immigrants | South Central Asia | 100.0 /100 | #17 | Exceptional $46,324 |
| Cypriots | 100.0 /100 | #18 | Exceptional $45,570 |
| Eastern Europeans | 100.0 /100 | #19 | Exceptional $45,385 |
| Immigrants | Japan | 100.0 /100 | #20 | Exceptional $45,323 |