Native/Alaskan vs Immigrants from France Median Female Earnings
COMPARE
Native/Alaskan
Immigrants from France
Median Female Earnings
Median Female Earnings Comparison
Natives/Alaskans
Immigrants from France
$33,806
MEDIAN FEMALE EARNINGS
0.0/ 100
METRIC RATING
331st/ 347
METRIC RANK
$44,541
MEDIAN FEMALE EARNINGS
100.0/ 100
METRIC RATING
31st/ 347
METRIC RANK
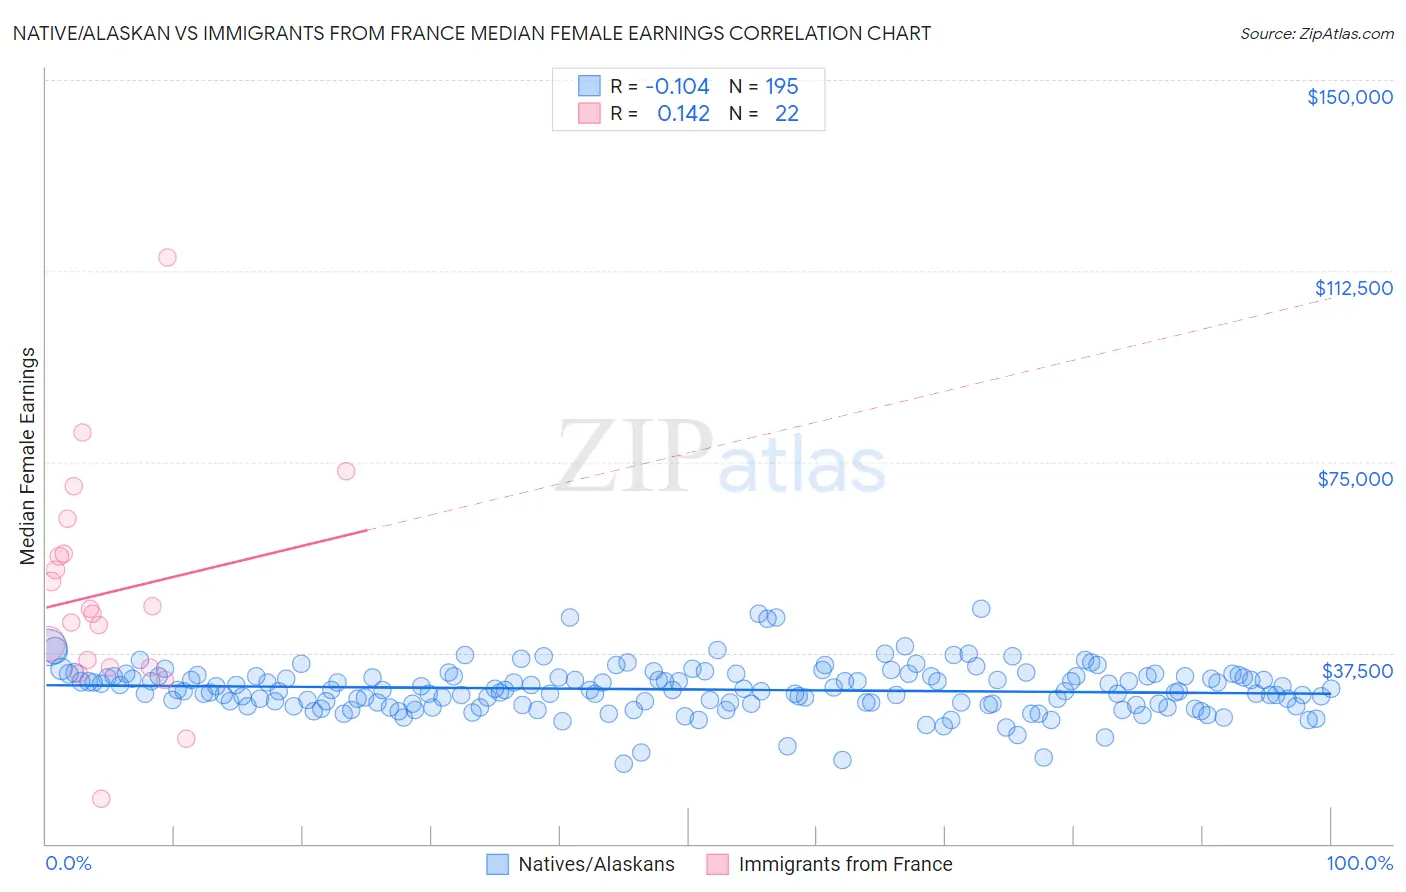
Native/Alaskan vs Immigrants from France Median Female Earnings Correlation Chart
The statistical analysis conducted on geographies consisting of 512,112,793 people shows a poor negative correlation between the proportion of Natives/Alaskans and median female earnings in the United States with a correlation coefficient (R) of -0.104 and weighted average of $33,806. Similarly, the statistical analysis conducted on geographies consisting of 287,837,863 people shows a poor positive correlation between the proportion of Immigrants from France and median female earnings in the United States with a correlation coefficient (R) of 0.142 and weighted average of $44,541, a difference of 31.8%.
Median Female Earnings Correlation Summary
| Measurement | Native/Alaskan | Immigrants from France |
| Minimum | $15,696 | $8,878 |
| Maximum | $46,195 | $115,017 |
| Range | $30,499 | $106,139 |
| Mean | $30,297 | $49,372 |
| Median | $30,121 | $45,659 |
| Interquartile 25% (IQ1) | $27,399 | $34,701 |
| Interquartile 75% (IQ3) | $32,868 | $56,964 |
| Interquartile Range (IQR) | $5,469 | $22,263 |
| Standard Deviation (Sample) | $4,739 | $22,329 |
| Standard Deviation (Population) | $4,727 | $21,816 |
Similar Demographics by Median Female Earnings
Demographics Similar to Natives/Alaskans by Median Female Earnings
In terms of median female earnings, the demographic groups most similar to Natives/Alaskans are Choctaw ($33,775, a difference of 0.090%), Menominee ($33,894, a difference of 0.26%), Hopi ($33,932, a difference of 0.37%), Mexican ($33,664, a difference of 0.42%), and Immigrants from Central America ($33,953, a difference of 0.43%).
| Demographics | Rating | Rank | Median Female Earnings |
| Immigrants | Congo | 0.0 /100 | #324 | Tragic $34,317 |
| Dutch West Indians | 0.0 /100 | #325 | Tragic $34,106 |
| Kiowa | 0.0 /100 | #326 | Tragic $34,074 |
| Cajuns | 0.0 /100 | #327 | Tragic $34,034 |
| Immigrants | Central America | 0.0 /100 | #328 | Tragic $33,953 |
| Hopi | 0.0 /100 | #329 | Tragic $33,932 |
| Menominee | 0.0 /100 | #330 | Tragic $33,894 |
| Natives/Alaskans | 0.0 /100 | #331 | Tragic $33,806 |
| Choctaw | 0.0 /100 | #332 | Tragic $33,775 |
| Mexicans | 0.0 /100 | #333 | Tragic $33,664 |
| Spanish American Indians | 0.0 /100 | #334 | Tragic $33,625 |
| Creek | 0.0 /100 | #335 | Tragic $33,437 |
| Ottawa | 0.0 /100 | #336 | Tragic $33,378 |
| Yakama | 0.0 /100 | #337 | Tragic $33,354 |
| Immigrants | Cuba | 0.0 /100 | #338 | Tragic $33,291 |
Demographics Similar to Immigrants from France by Median Female Earnings
In terms of median female earnings, the demographic groups most similar to Immigrants from France are Immigrants from Belgium ($44,587, a difference of 0.10%), Asian ($44,586, a difference of 0.10%), Immigrants from Russia ($44,680, a difference of 0.31%), Turkish ($44,695, a difference of 0.34%), and Immigrants from Northern Europe ($44,366, a difference of 0.40%).
| Demographics | Rating | Rank | Median Female Earnings |
| Immigrants | Korea | 100.0 /100 | #24 | Exceptional $44,847 |
| Immigrants | Sweden | 100.0 /100 | #25 | Exceptional $44,774 |
| Immigrants | Belarus | 100.0 /100 | #26 | Exceptional $44,757 |
| Turks | 100.0 /100 | #27 | Exceptional $44,695 |
| Immigrants | Russia | 100.0 /100 | #28 | Exceptional $44,680 |
| Immigrants | Belgium | 100.0 /100 | #29 | Exceptional $44,587 |
| Asians | 100.0 /100 | #30 | Exceptional $44,586 |
| Immigrants | France | 100.0 /100 | #31 | Exceptional $44,541 |
| Immigrants | Northern Europe | 100.0 /100 | #32 | Exceptional $44,366 |
| Immigrants | Asia | 100.0 /100 | #33 | Exceptional $44,198 |
| Russians | 100.0 /100 | #34 | Exceptional $44,169 |
| Immigrants | Sri Lanka | 100.0 /100 | #35 | Exceptional $44,161 |
| Immigrants | Turkey | 100.0 /100 | #36 | Exceptional $44,066 |
| Immigrants | Switzerland | 100.0 /100 | #37 | Exceptional $43,996 |
| Latvians | 100.0 /100 | #38 | Exceptional $43,941 |