Nigerian vs Yaqui Median Earnings
COMPARE
Nigerian
Yaqui
Median Earnings
Median Earnings Comparison
Nigerians
Yaqui
$45,532
MEDIAN EARNINGS
22.0/ 100
METRIC RATING
214th/ 347
METRIC RANK
$40,647
MEDIAN EARNINGS
0.0/ 100
METRIC RATING
306th/ 347
METRIC RANK
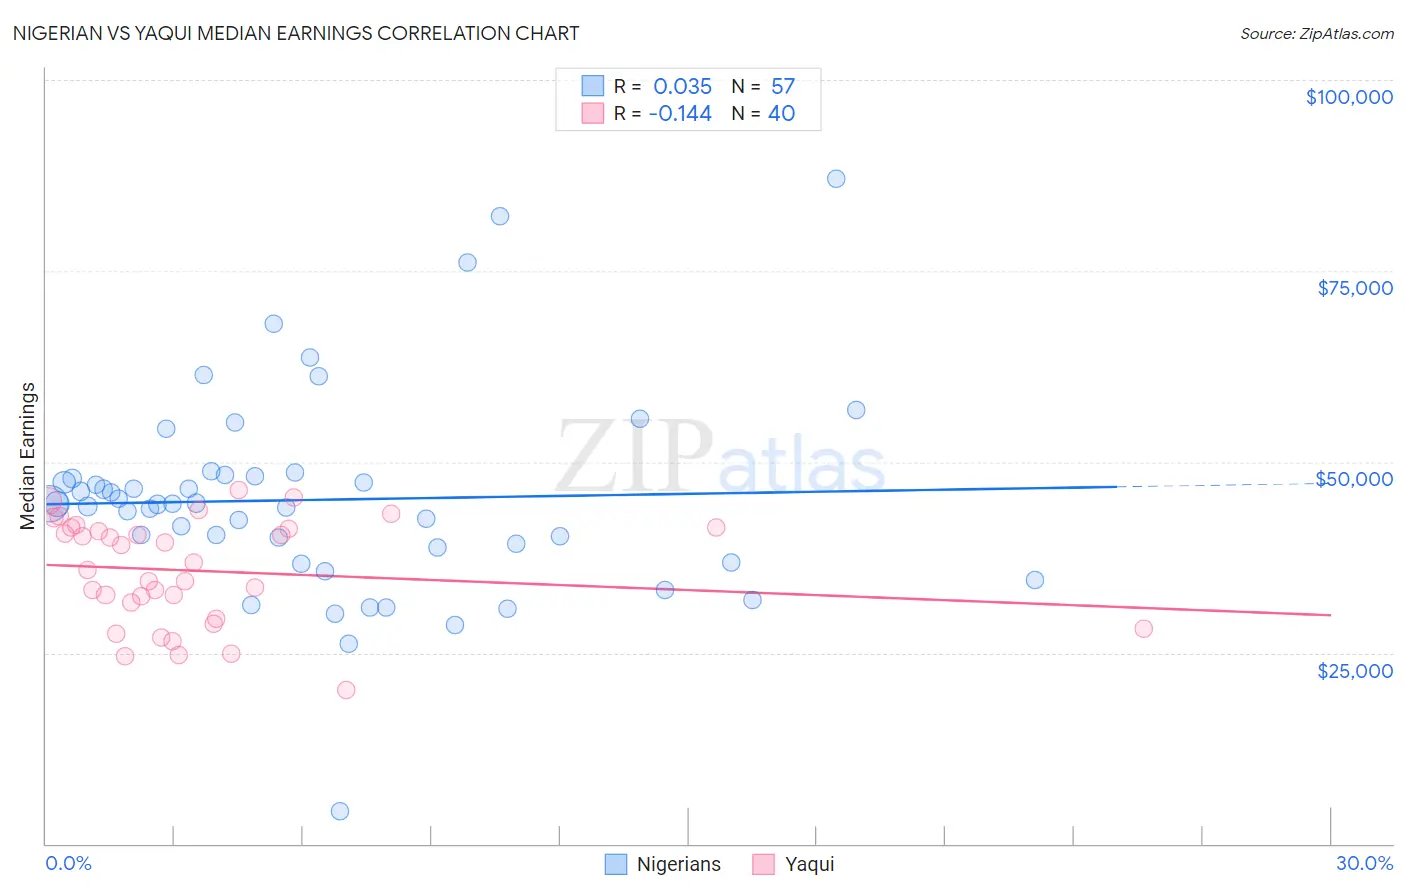
Nigerian vs Yaqui Median Earnings Correlation Chart
The statistical analysis conducted on geographies consisting of 332,779,942 people shows no correlation between the proportion of Nigerians and median earnings in the United States with a correlation coefficient (R) of 0.035 and weighted average of $45,532. Similarly, the statistical analysis conducted on geographies consisting of 107,736,593 people shows a poor negative correlation between the proportion of Yaqui and median earnings in the United States with a correlation coefficient (R) of -0.144 and weighted average of $40,647, a difference of 12.0%.
Median Earnings Correlation Summary
| Measurement | Nigerian | Yaqui |
| Minimum | $4,253 | $20,058 |
| Maximum | $87,061 | $46,273 |
| Range | $82,808 | $26,215 |
| Mean | $45,043 | $35,713 |
| Median | $44,458 | $36,396 |
| Interquartile 25% (IQ1) | $37,816 | $30,515 |
| Interquartile 75% (IQ3) | $48,156 | $41,344 |
| Interquartile Range (IQR) | $10,339 | $10,829 |
| Standard Deviation (Sample) | $13,482 | $6,900 |
| Standard Deviation (Population) | $13,364 | $6,813 |
Similar Demographics by Median Earnings
Demographics Similar to Nigerians by Median Earnings
In terms of median earnings, the demographic groups most similar to Nigerians are Immigrants from Bangladesh ($45,532, a difference of 0.0%), Immigrants from Colombia ($45,550, a difference of 0.040%), Panamanian ($45,593, a difference of 0.13%), Bermudan ($45,593, a difference of 0.13%), and Immigrants from Grenada ($45,596, a difference of 0.14%).
| Demographics | Rating | Rank | Median Earnings |
| Immigrants | Senegal | 24.0 /100 | #207 | Fair $45,611 |
| Immigrants | Bosnia and Herzegovina | 23.7 /100 | #208 | Fair $45,600 |
| Immigrants | Thailand | 23.7 /100 | #209 | Fair $45,598 |
| Immigrants | Grenada | 23.6 /100 | #210 | Fair $45,596 |
| Panamanians | 23.5 /100 | #211 | Fair $45,593 |
| Bermudans | 23.5 /100 | #212 | Fair $45,593 |
| Immigrants | Colombia | 22.4 /100 | #213 | Fair $45,550 |
| Nigerians | 22.0 /100 | #214 | Fair $45,532 |
| Immigrants | Bangladesh | 22.0 /100 | #215 | Fair $45,532 |
| Guyanese | 20.6 /100 | #216 | Fair $45,470 |
| Tlingit-Haida | 20.5 /100 | #217 | Fair $45,468 |
| Spanish | 19.7 /100 | #218 | Poor $45,432 |
| Dutch | 18.4 /100 | #219 | Poor $45,370 |
| Ecuadorians | 15.3 /100 | #220 | Poor $45,214 |
| Immigrants | Guyana | 15.1 /100 | #221 | Poor $45,204 |
Demographics Similar to Yaqui by Median Earnings
In terms of median earnings, the demographic groups most similar to Yaqui are Honduran ($40,638, a difference of 0.020%), Chickasaw ($40,672, a difference of 0.060%), Cuban ($40,619, a difference of 0.070%), Immigrants from Haiti ($40,550, a difference of 0.24%), and Immigrants from Guatemala ($40,851, a difference of 0.50%).
| Demographics | Rating | Rank | Median Earnings |
| Immigrants | Caribbean | 0.1 /100 | #299 | Tragic $41,119 |
| Ute | 0.1 /100 | #300 | Tragic $41,051 |
| Immigrants | Latin America | 0.1 /100 | #301 | Tragic $41,049 |
| Shoshone | 0.0 /100 | #302 | Tragic $40,932 |
| Haitians | 0.0 /100 | #303 | Tragic $40,918 |
| Immigrants | Guatemala | 0.0 /100 | #304 | Tragic $40,851 |
| Chickasaw | 0.0 /100 | #305 | Tragic $40,672 |
| Yaqui | 0.0 /100 | #306 | Tragic $40,647 |
| Hondurans | 0.0 /100 | #307 | Tragic $40,638 |
| Cubans | 0.0 /100 | #308 | Tragic $40,619 |
| Immigrants | Haiti | 0.0 /100 | #309 | Tragic $40,550 |
| Apache | 0.0 /100 | #310 | Tragic $40,388 |
| Hispanics or Latinos | 0.0 /100 | #311 | Tragic $40,288 |
| Chippewa | 0.0 /100 | #312 | Tragic $40,287 |
| Choctaw | 0.0 /100 | #313 | Tragic $40,270 |