Immigrants from Korea vs Immigrants from Moldova Median Earnings
COMPARE
Immigrants from Korea
Immigrants from Moldova
Median Earnings
Median Earnings Comparison
Immigrants from Korea
Immigrants from Moldova
$54,530
MEDIAN EARNINGS
100.0/ 100
METRIC RATING
22nd/ 347
METRIC RANK
$50,274
MEDIAN EARNINGS
99.5/ 100
METRIC RATING
82nd/ 347
METRIC RANK
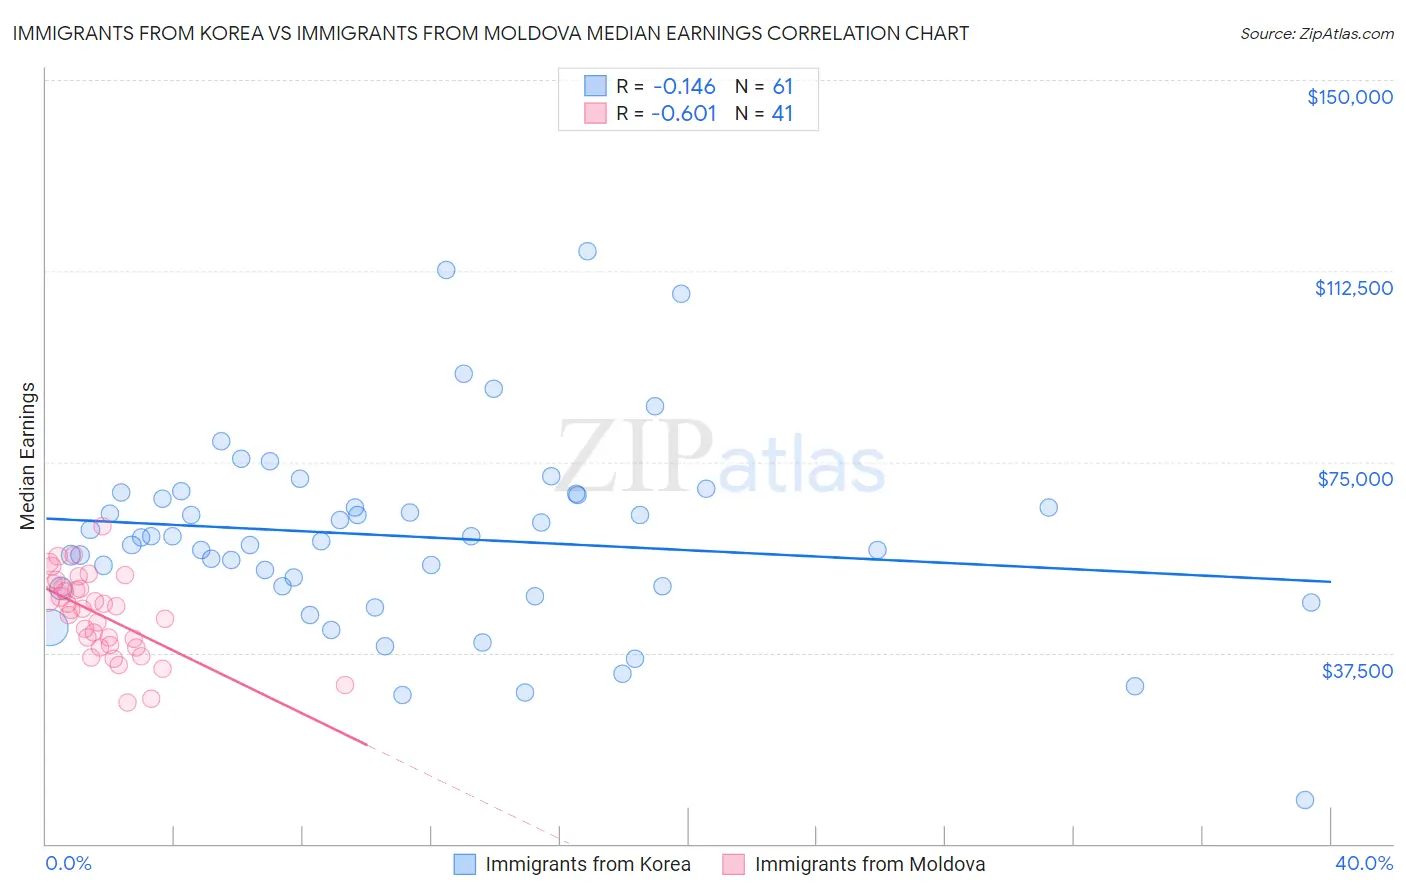
Immigrants from Korea vs Immigrants from Moldova Median Earnings Correlation Chart
The statistical analysis conducted on geographies consisting of 416,330,492 people shows a poor negative correlation between the proportion of Immigrants from Korea and median earnings in the United States with a correlation coefficient (R) of -0.146 and weighted average of $54,530. Similarly, the statistical analysis conducted on geographies consisting of 124,398,835 people shows a significant negative correlation between the proportion of Immigrants from Moldova and median earnings in the United States with a correlation coefficient (R) of -0.601 and weighted average of $50,274, a difference of 8.5%.
Median Earnings Correlation Summary
| Measurement | Immigrants from Korea | Immigrants from Moldova |
| Minimum | $8,707 | $27,768 |
| Maximum | $116,380 | $62,360 |
| Range | $107,673 | $34,592 |
| Mean | $60,321 | $44,970 |
| Median | $60,242 | $46,266 |
| Interquartile 25% (IQ1) | $50,376 | $38,796 |
| Interquartile 75% (IQ3) | $68,586 | $50,724 |
| Interquartile Range (IQR) | $18,211 | $11,928 |
| Standard Deviation (Sample) | $19,123 | $7,997 |
| Standard Deviation (Population) | $18,966 | $7,899 |
Similar Demographics by Median Earnings
Demographics Similar to Immigrants from Korea by Median Earnings
In terms of median earnings, the demographic groups most similar to Immigrants from Korea are Burmese ($54,559, a difference of 0.050%), Immigrants from Sweden ($54,478, a difference of 0.10%), Cypriot ($54,589, a difference of 0.11%), Immigrants from Belgium ($54,679, a difference of 0.27%), and Soviet Union ($54,290, a difference of 0.44%).
| Demographics | Rating | Rank | Median Earnings |
| Indians (Asian) | 100.0 /100 | #15 | Exceptional $56,253 |
| Immigrants | Eastern Asia | 100.0 /100 | #16 | Exceptional $56,183 |
| Eastern Europeans | 100.0 /100 | #17 | Exceptional $55,084 |
| Immigrants | Japan | 100.0 /100 | #18 | Exceptional $54,938 |
| Immigrants | Belgium | 100.0 /100 | #19 | Exceptional $54,679 |
| Cypriots | 100.0 /100 | #20 | Exceptional $54,589 |
| Burmese | 100.0 /100 | #21 | Exceptional $54,559 |
| Immigrants | Korea | 100.0 /100 | #22 | Exceptional $54,530 |
| Immigrants | Sweden | 100.0 /100 | #23 | Exceptional $54,478 |
| Soviet Union | 100.0 /100 | #24 | Exceptional $54,290 |
| Turks | 100.0 /100 | #25 | Exceptional $53,919 |
| Immigrants | Northern Europe | 100.0 /100 | #26 | Exceptional $53,872 |
| Asians | 100.0 /100 | #27 | Exceptional $53,690 |
| Immigrants | France | 100.0 /100 | #28 | Exceptional $53,490 |
| Immigrants | Russia | 100.0 /100 | #29 | Exceptional $53,457 |
Demographics Similar to Immigrants from Moldova by Median Earnings
In terms of median earnings, the demographic groups most similar to Immigrants from Moldova are Immigrants from Southern Europe ($50,280, a difference of 0.010%), Romanian ($50,244, a difference of 0.060%), Ukrainian ($50,320, a difference of 0.090%), Immigrants from Hungary ($50,227, a difference of 0.090%), and Immigrants from Kazakhstan ($50,225, a difference of 0.10%).
| Demographics | Rating | Rank | Median Earnings |
| Immigrants | Scotland | 99.8 /100 | #75 | Exceptional $50,741 |
| Immigrants | Italy | 99.7 /100 | #76 | Exceptional $50,581 |
| Immigrants | Western Europe | 99.7 /100 | #77 | Exceptional $50,549 |
| Argentineans | 99.6 /100 | #78 | Exceptional $50,399 |
| Laotians | 99.6 /100 | #79 | Exceptional $50,343 |
| Ukrainians | 99.6 /100 | #80 | Exceptional $50,320 |
| Immigrants | Southern Europe | 99.6 /100 | #81 | Exceptional $50,280 |
| Immigrants | Moldova | 99.5 /100 | #82 | Exceptional $50,274 |
| Romanians | 99.5 /100 | #83 | Exceptional $50,244 |
| Immigrants | Hungary | 99.5 /100 | #84 | Exceptional $50,227 |
| Immigrants | Kazakhstan | 99.5 /100 | #85 | Exceptional $50,225 |
| Immigrants | Canada | 99.5 /100 | #86 | Exceptional $50,192 |
| Immigrants | Uzbekistan | 99.5 /100 | #87 | Exceptional $50,151 |
| Albanians | 99.4 /100 | #88 | Exceptional $50,116 |
| Immigrants | North America | 99.4 /100 | #89 | Exceptional $50,108 |