British West Indian vs Immigrants from Moldova Median Earnings
COMPARE
British West Indian
Immigrants from Moldova
Median Earnings
Median Earnings Comparison
British West Indians
Immigrants from Moldova
$44,552
MEDIAN EARNINGS
6.7/ 100
METRIC RATING
236th/ 347
METRIC RANK
$50,274
MEDIAN EARNINGS
99.5/ 100
METRIC RATING
82nd/ 347
METRIC RANK
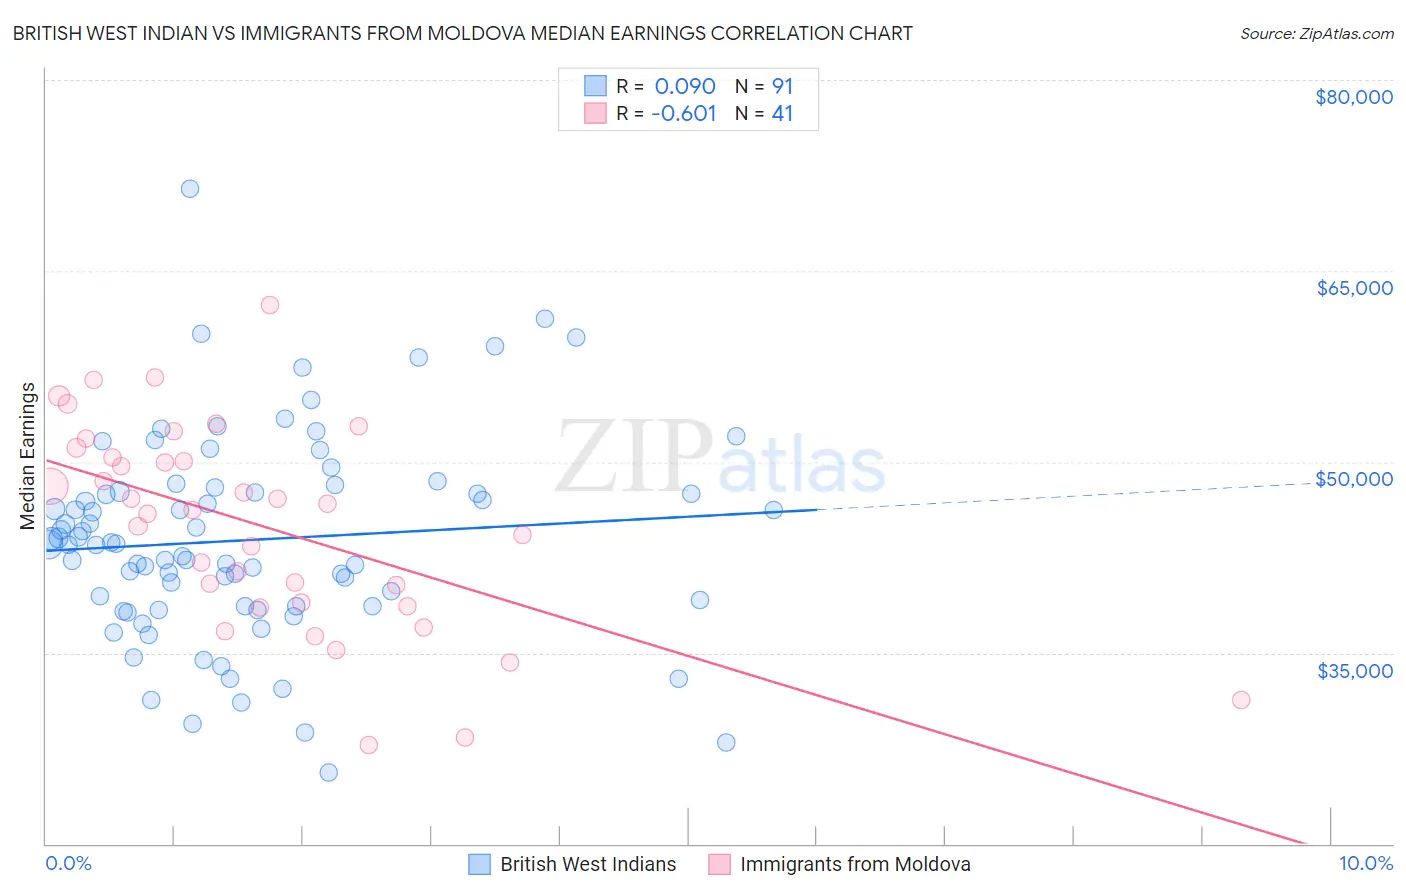
British West Indian vs Immigrants from Moldova Median Earnings Correlation Chart
The statistical analysis conducted on geographies consisting of 152,701,918 people shows a slight positive correlation between the proportion of British West Indians and median earnings in the United States with a correlation coefficient (R) of 0.090 and weighted average of $44,552. Similarly, the statistical analysis conducted on geographies consisting of 124,398,835 people shows a significant negative correlation between the proportion of Immigrants from Moldova and median earnings in the United States with a correlation coefficient (R) of -0.601 and weighted average of $50,274, a difference of 12.9%.
Median Earnings Correlation Summary
| Measurement | British West Indian | Immigrants from Moldova |
| Minimum | $25,617 | $27,768 |
| Maximum | $71,446 | $62,360 |
| Range | $45,829 | $34,592 |
| Mean | $43,859 | $44,970 |
| Median | $43,512 | $46,266 |
| Interquartile 25% (IQ1) | $38,648 | $38,796 |
| Interquartile 75% (IQ3) | $47,645 | $50,724 |
| Interquartile Range (IQR) | $8,997 | $11,928 |
| Standard Deviation (Sample) | $7,987 | $7,997 |
| Standard Deviation (Population) | $7,943 | $7,899 |
Similar Demographics by Median Earnings
Demographics Similar to British West Indians by Median Earnings
In terms of median earnings, the demographic groups most similar to British West Indians are Venezuelan ($44,580, a difference of 0.060%), Cape Verdean ($44,640, a difference of 0.20%), Immigrants from Ecuador ($44,462, a difference of 0.20%), Sudanese ($44,419, a difference of 0.30%), and Senegalese ($44,373, a difference of 0.40%).
| Demographics | Rating | Rank | Median Earnings |
| Scotch-Irish | 10.7 /100 | #229 | Poor $44,924 |
| Immigrants | Western Africa | 10.3 /100 | #230 | Poor $44,893 |
| Japanese | 9.5 /100 | #231 | Tragic $44,825 |
| Delaware | 9.0 /100 | #232 | Tragic $44,783 |
| Immigrants | Sudan | 8.8 /100 | #233 | Tragic $44,767 |
| Cape Verdeans | 7.5 /100 | #234 | Tragic $44,640 |
| Venezuelans | 6.9 /100 | #235 | Tragic $44,580 |
| British West Indians | 6.7 /100 | #236 | Tragic $44,552 |
| Immigrants | Ecuador | 5.9 /100 | #237 | Tragic $44,462 |
| Sudanese | 5.6 /100 | #238 | Tragic $44,419 |
| Senegalese | 5.3 /100 | #239 | Tragic $44,373 |
| Aleuts | 4.4 /100 | #240 | Tragic $44,241 |
| Samoans | 4.2 /100 | #241 | Tragic $44,206 |
| Immigrants | Venezuela | 4.0 /100 | #242 | Tragic $44,163 |
| Sub-Saharan Africans | 3.7 /100 | #243 | Tragic $44,118 |
Demographics Similar to Immigrants from Moldova by Median Earnings
In terms of median earnings, the demographic groups most similar to Immigrants from Moldova are Immigrants from Southern Europe ($50,280, a difference of 0.010%), Romanian ($50,244, a difference of 0.060%), Ukrainian ($50,320, a difference of 0.090%), Immigrants from Hungary ($50,227, a difference of 0.090%), and Immigrants from Kazakhstan ($50,225, a difference of 0.10%).
| Demographics | Rating | Rank | Median Earnings |
| Immigrants | Scotland | 99.8 /100 | #75 | Exceptional $50,741 |
| Immigrants | Italy | 99.7 /100 | #76 | Exceptional $50,581 |
| Immigrants | Western Europe | 99.7 /100 | #77 | Exceptional $50,549 |
| Argentineans | 99.6 /100 | #78 | Exceptional $50,399 |
| Laotians | 99.6 /100 | #79 | Exceptional $50,343 |
| Ukrainians | 99.6 /100 | #80 | Exceptional $50,320 |
| Immigrants | Southern Europe | 99.6 /100 | #81 | Exceptional $50,280 |
| Immigrants | Moldova | 99.5 /100 | #82 | Exceptional $50,274 |
| Romanians | 99.5 /100 | #83 | Exceptional $50,244 |
| Immigrants | Hungary | 99.5 /100 | #84 | Exceptional $50,227 |
| Immigrants | Kazakhstan | 99.5 /100 | #85 | Exceptional $50,225 |
| Immigrants | Canada | 99.5 /100 | #86 | Exceptional $50,192 |
| Immigrants | Uzbekistan | 99.5 /100 | #87 | Exceptional $50,151 |
| Albanians | 99.4 /100 | #88 | Exceptional $50,116 |
| Immigrants | North America | 99.4 /100 | #89 | Exceptional $50,108 |