Moroccan vs Immigrants from Italy Median Earnings
COMPARE
Moroccan
Immigrants from Italy
Median Earnings
Median Earnings Comparison
Moroccans
Immigrants from Italy
$48,838
MEDIAN EARNINGS
96.7/ 100
METRIC RATING
114th/ 347
METRIC RANK
$50,581
MEDIAN EARNINGS
99.7/ 100
METRIC RATING
76th/ 347
METRIC RANK
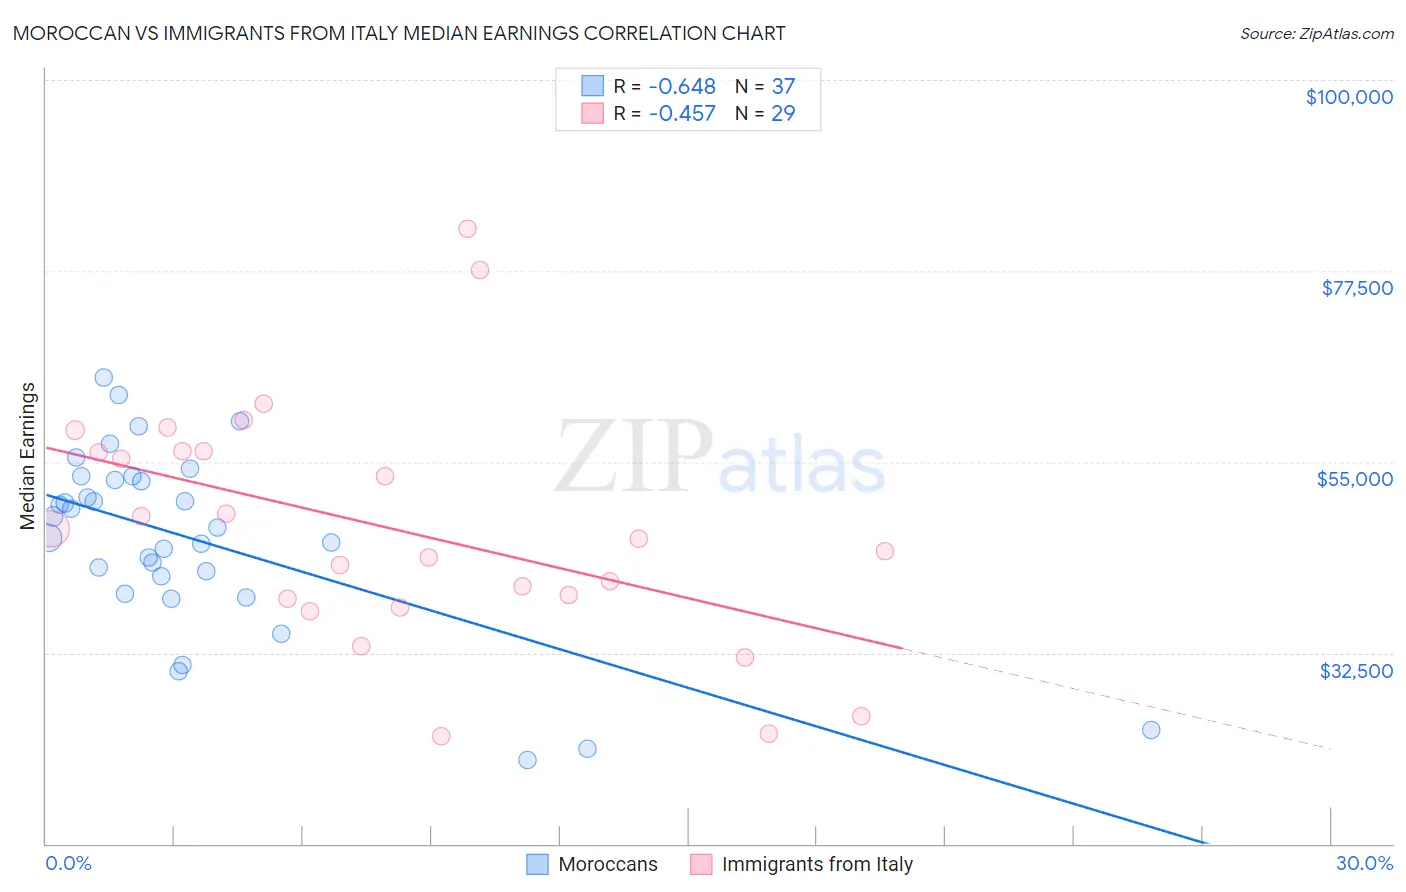
Moroccan vs Immigrants from Italy Median Earnings Correlation Chart
The statistical analysis conducted on geographies consisting of 201,800,770 people shows a significant negative correlation between the proportion of Moroccans and median earnings in the United States with a correlation coefficient (R) of -0.648 and weighted average of $48,838. Similarly, the statistical analysis conducted on geographies consisting of 324,208,754 people shows a moderate negative correlation between the proportion of Immigrants from Italy and median earnings in the United States with a correlation coefficient (R) of -0.457 and weighted average of $50,581, a difference of 3.6%.
Median Earnings Correlation Summary
| Measurement | Moroccan | Immigrants from Italy |
| Minimum | $19,886 | $22,656 |
| Maximum | $64,979 | $82,450 |
| Range | $45,093 | $59,794 |
| Mean | $45,820 | $47,205 |
| Median | $47,333 | $46,000 |
| Interquartile 25% (IQ1) | $40,473 | $38,371 |
| Interquartile 75% (IQ3) | $53,052 | $56,217 |
| Interquartile Range (IQR) | $12,578 | $17,846 |
| Standard Deviation (Sample) | $10,819 | $14,283 |
| Standard Deviation (Population) | $10,672 | $14,035 |
Similar Demographics by Median Earnings
Demographics Similar to Moroccans by Median Earnings
In terms of median earnings, the demographic groups most similar to Moroccans are Chinese ($48,836, a difference of 0.010%), Immigrants from Kuwait ($48,861, a difference of 0.050%), Northern European ($48,887, a difference of 0.10%), Immigrants from Zimbabwe ($48,913, a difference of 0.15%), and Immigrants from Ethiopia ($48,924, a difference of 0.17%).
| Demographics | Rating | Rank | Median Earnings |
| Immigrants | Morocco | 98.4 /100 | #107 | Exceptional $49,368 |
| Palestinians | 98.0 /100 | #108 | Exceptional $49,209 |
| Syrians | 97.1 /100 | #109 | Exceptional $48,934 |
| Immigrants | Ethiopia | 97.1 /100 | #110 | Exceptional $48,924 |
| Immigrants | Zimbabwe | 97.0 /100 | #111 | Exceptional $48,913 |
| Northern Europeans | 96.9 /100 | #112 | Exceptional $48,887 |
| Immigrants | Kuwait | 96.8 /100 | #113 | Exceptional $48,861 |
| Moroccans | 96.7 /100 | #114 | Exceptional $48,838 |
| Chinese | 96.7 /100 | #115 | Exceptional $48,836 |
| Koreans | 96.2 /100 | #116 | Exceptional $48,727 |
| Serbians | 95.9 /100 | #117 | Exceptional $48,677 |
| Immigrants | Jordan | 95.9 /100 | #118 | Exceptional $48,673 |
| Poles | 95.8 /100 | #119 | Exceptional $48,659 |
| Carpatho Rusyns | 95.5 /100 | #120 | Exceptional $48,617 |
| Arabs | 95.4 /100 | #121 | Exceptional $48,599 |
Demographics Similar to Immigrants from Italy by Median Earnings
In terms of median earnings, the demographic groups most similar to Immigrants from Italy are Immigrants from Western Europe ($50,549, a difference of 0.060%), Immigrants from Scotland ($50,741, a difference of 0.32%), South African ($50,752, a difference of 0.34%), Argentinean ($50,399, a difference of 0.36%), and Immigrants from Netherlands ($50,818, a difference of 0.47%).
| Demographics | Rating | Rank | Median Earnings |
| Mongolians | 99.8 /100 | #69 | Exceptional $51,038 |
| Lithuanians | 99.8 /100 | #70 | Exceptional $50,991 |
| Immigrants | Ukraine | 99.8 /100 | #71 | Exceptional $50,984 |
| Immigrants | Egypt | 99.8 /100 | #72 | Exceptional $50,901 |
| Immigrants | Netherlands | 99.8 /100 | #73 | Exceptional $50,818 |
| South Africans | 99.8 /100 | #74 | Exceptional $50,752 |
| Immigrants | Scotland | 99.8 /100 | #75 | Exceptional $50,741 |
| Immigrants | Italy | 99.7 /100 | #76 | Exceptional $50,581 |
| Immigrants | Western Europe | 99.7 /100 | #77 | Exceptional $50,549 |
| Argentineans | 99.6 /100 | #78 | Exceptional $50,399 |
| Laotians | 99.6 /100 | #79 | Exceptional $50,343 |
| Ukrainians | 99.6 /100 | #80 | Exceptional $50,320 |
| Immigrants | Southern Europe | 99.6 /100 | #81 | Exceptional $50,280 |
| Immigrants | Moldova | 99.5 /100 | #82 | Exceptional $50,274 |
| Romanians | 99.5 /100 | #83 | Exceptional $50,244 |