Moroccan vs German Russian Median Earnings
COMPARE
Moroccan
German Russian
Median Earnings
Median Earnings Comparison
Moroccans
German Russians
$48,838
MEDIAN EARNINGS
96.7/ 100
METRIC RATING
114th/ 347
METRIC RANK
$43,200
MEDIAN EARNINGS
1.1/ 100
METRIC RATING
259th/ 347
METRIC RANK
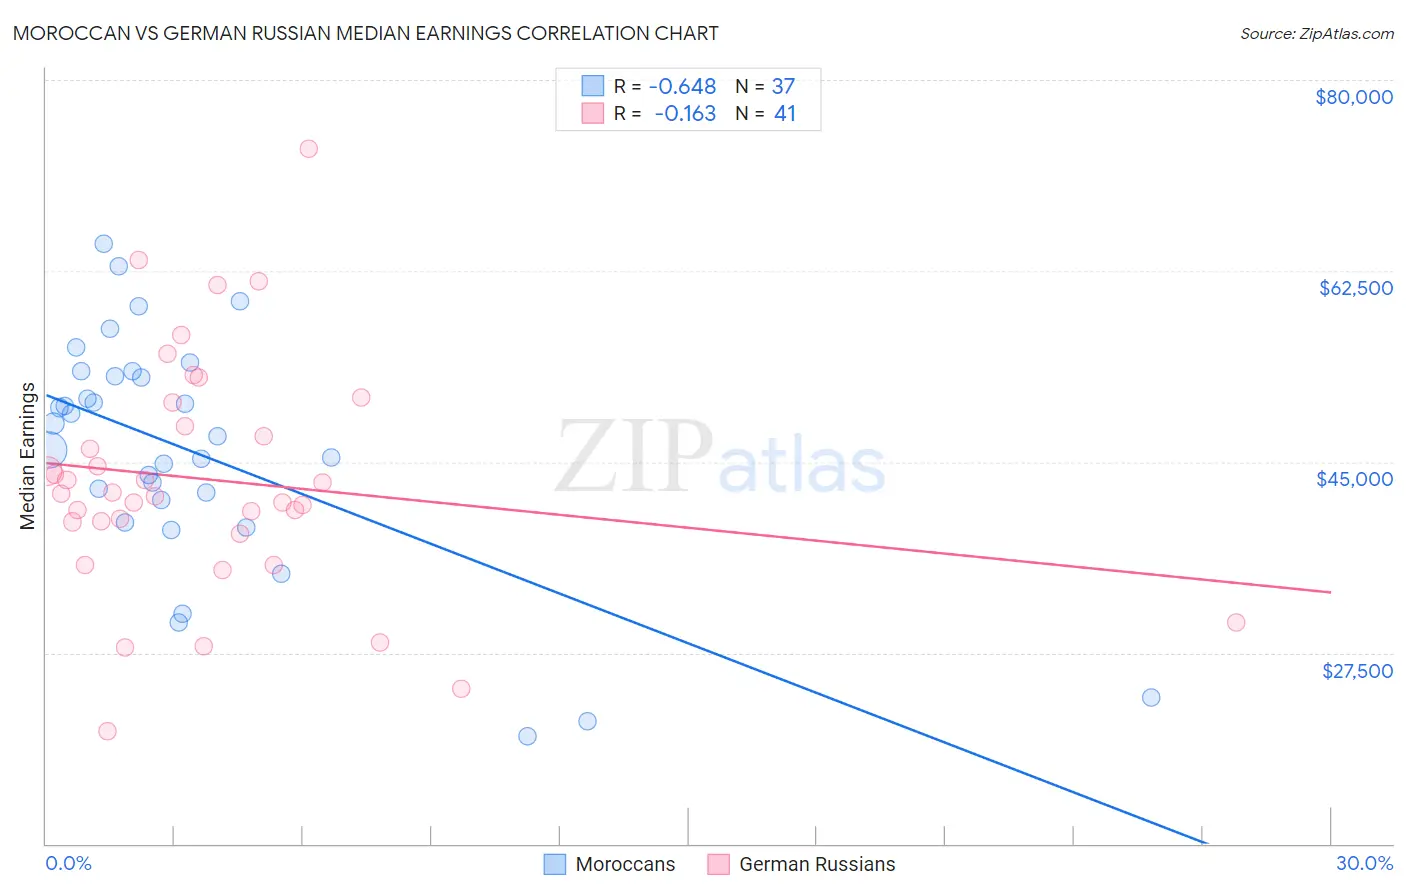
Moroccan vs German Russian Median Earnings Correlation Chart
The statistical analysis conducted on geographies consisting of 201,800,770 people shows a significant negative correlation between the proportion of Moroccans and median earnings in the United States with a correlation coefficient (R) of -0.648 and weighted average of $48,838. Similarly, the statistical analysis conducted on geographies consisting of 96,461,266 people shows a poor negative correlation between the proportion of German Russians and median earnings in the United States with a correlation coefficient (R) of -0.163 and weighted average of $43,200, a difference of 13.1%.
Median Earnings Correlation Summary
| Measurement | Moroccan | German Russian |
| Minimum | $19,886 | $20,324 |
| Maximum | $64,979 | $73,750 |
| Range | $45,093 | $53,426 |
| Mean | $45,820 | $43,344 |
| Median | $47,333 | $42,036 |
| Interquartile 25% (IQ1) | $40,473 | $38,952 |
| Interquartile 75% (IQ3) | $53,052 | $49,348 |
| Interquartile Range (IQR) | $12,578 | $10,396 |
| Standard Deviation (Sample) | $10,819 | $10,822 |
| Standard Deviation (Population) | $10,672 | $10,689 |
Similar Demographics by Median Earnings
Demographics Similar to Moroccans by Median Earnings
In terms of median earnings, the demographic groups most similar to Moroccans are Chinese ($48,836, a difference of 0.010%), Immigrants from Kuwait ($48,861, a difference of 0.050%), Northern European ($48,887, a difference of 0.10%), Immigrants from Zimbabwe ($48,913, a difference of 0.15%), and Immigrants from Ethiopia ($48,924, a difference of 0.17%).
| Demographics | Rating | Rank | Median Earnings |
| Immigrants | Morocco | 98.4 /100 | #107 | Exceptional $49,368 |
| Palestinians | 98.0 /100 | #108 | Exceptional $49,209 |
| Syrians | 97.1 /100 | #109 | Exceptional $48,934 |
| Immigrants | Ethiopia | 97.1 /100 | #110 | Exceptional $48,924 |
| Immigrants | Zimbabwe | 97.0 /100 | #111 | Exceptional $48,913 |
| Northern Europeans | 96.9 /100 | #112 | Exceptional $48,887 |
| Immigrants | Kuwait | 96.8 /100 | #113 | Exceptional $48,861 |
| Moroccans | 96.7 /100 | #114 | Exceptional $48,838 |
| Chinese | 96.7 /100 | #115 | Exceptional $48,836 |
| Koreans | 96.2 /100 | #116 | Exceptional $48,727 |
| Serbians | 95.9 /100 | #117 | Exceptional $48,677 |
| Immigrants | Jordan | 95.9 /100 | #118 | Exceptional $48,673 |
| Poles | 95.8 /100 | #119 | Exceptional $48,659 |
| Carpatho Rusyns | 95.5 /100 | #120 | Exceptional $48,617 |
| Arabs | 95.4 /100 | #121 | Exceptional $48,599 |
Demographics Similar to German Russians by Median Earnings
In terms of median earnings, the demographic groups most similar to German Russians are Immigrants from Somalia ($43,100, a difference of 0.23%), French American Indian ($43,333, a difference of 0.31%), Jamaican ($43,343, a difference of 0.33%), Immigrants from Jamaica ($43,026, a difference of 0.40%), and Nicaraguan ($43,026, a difference of 0.40%).
| Demographics | Rating | Rank | Median Earnings |
| Hawaiians | 2.0 /100 | #252 | Tragic $43,673 |
| Somalis | 1.8 /100 | #253 | Tragic $43,567 |
| Liberians | 1.7 /100 | #254 | Tragic $43,536 |
| Immigrants | Middle Africa | 1.4 /100 | #255 | Tragic $43,416 |
| Alaskan Athabascans | 1.4 /100 | #256 | Tragic $43,393 |
| Jamaicans | 1.3 /100 | #257 | Tragic $43,343 |
| French American Indians | 1.3 /100 | #258 | Tragic $43,333 |
| German Russians | 1.1 /100 | #259 | Tragic $43,200 |
| Immigrants | Somalia | 0.9 /100 | #260 | Tragic $43,100 |
| Immigrants | Jamaica | 0.8 /100 | #261 | Tragic $43,026 |
| Nicaraguans | 0.8 /100 | #262 | Tragic $43,026 |
| Inupiat | 0.8 /100 | #263 | Tragic $43,000 |
| Immigrants | Liberia | 0.7 /100 | #264 | Tragic $42,923 |
| Salvadorans | 0.7 /100 | #265 | Tragic $42,912 |
| Immigrants | Laos | 0.7 /100 | #266 | Tragic $42,884 |