Moroccan vs Immigrants from Iraq Median Earnings
COMPARE
Moroccan
Immigrants from Iraq
Median Earnings
Median Earnings Comparison
Moroccans
Immigrants from Iraq
$48,838
MEDIAN EARNINGS
96.7/ 100
METRIC RATING
114th/ 347
METRIC RANK
$44,988
MEDIAN EARNINGS
11.6/ 100
METRIC RATING
228th/ 347
METRIC RANK
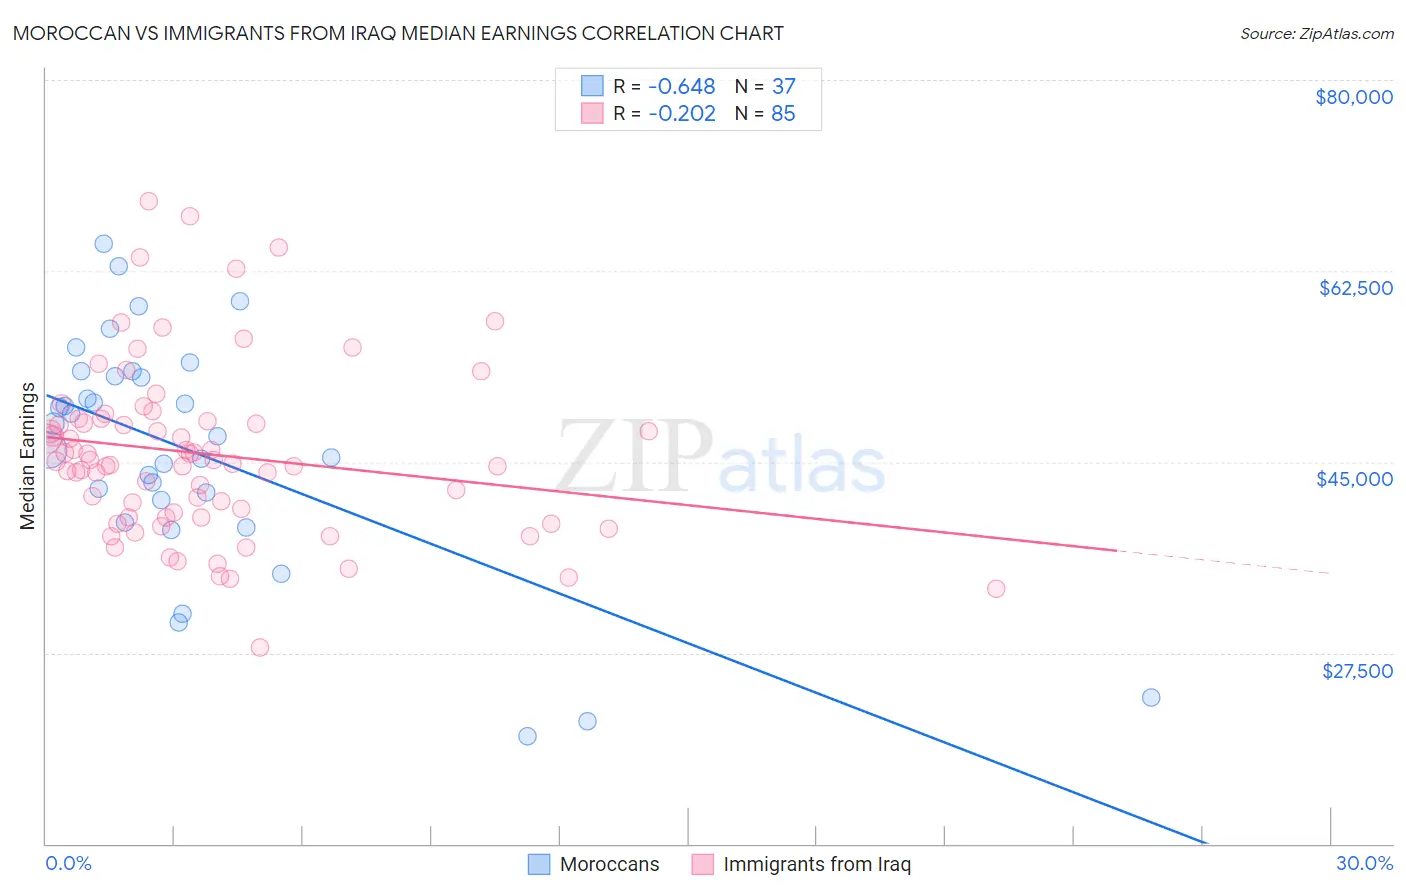
Moroccan vs Immigrants from Iraq Median Earnings Correlation Chart
The statistical analysis conducted on geographies consisting of 201,800,770 people shows a significant negative correlation between the proportion of Moroccans and median earnings in the United States with a correlation coefficient (R) of -0.648 and weighted average of $48,838. Similarly, the statistical analysis conducted on geographies consisting of 194,784,427 people shows a weak negative correlation between the proportion of Immigrants from Iraq and median earnings in the United States with a correlation coefficient (R) of -0.202 and weighted average of $44,988, a difference of 8.6%.
Median Earnings Correlation Summary
| Measurement | Moroccan | Immigrants from Iraq |
| Minimum | $19,886 | $27,932 |
| Maximum | $64,979 | $68,937 |
| Range | $45,093 | $41,005 |
| Mean | $45,820 | $45,692 |
| Median | $47,333 | $45,037 |
| Interquartile 25% (IQ1) | $40,473 | $39,916 |
| Interquartile 75% (IQ3) | $53,052 | $48,838 |
| Interquartile Range (IQR) | $12,578 | $8,923 |
| Standard Deviation (Sample) | $10,819 | $7,829 |
| Standard Deviation (Population) | $10,672 | $7,782 |
Similar Demographics by Median Earnings
Demographics Similar to Moroccans by Median Earnings
In terms of median earnings, the demographic groups most similar to Moroccans are Chinese ($48,836, a difference of 0.010%), Immigrants from Kuwait ($48,861, a difference of 0.050%), Northern European ($48,887, a difference of 0.10%), Immigrants from Zimbabwe ($48,913, a difference of 0.15%), and Immigrants from Ethiopia ($48,924, a difference of 0.17%).
| Demographics | Rating | Rank | Median Earnings |
| Immigrants | Morocco | 98.4 /100 | #107 | Exceptional $49,368 |
| Palestinians | 98.0 /100 | #108 | Exceptional $49,209 |
| Syrians | 97.1 /100 | #109 | Exceptional $48,934 |
| Immigrants | Ethiopia | 97.1 /100 | #110 | Exceptional $48,924 |
| Immigrants | Zimbabwe | 97.0 /100 | #111 | Exceptional $48,913 |
| Northern Europeans | 96.9 /100 | #112 | Exceptional $48,887 |
| Immigrants | Kuwait | 96.8 /100 | #113 | Exceptional $48,861 |
| Moroccans | 96.7 /100 | #114 | Exceptional $48,838 |
| Chinese | 96.7 /100 | #115 | Exceptional $48,836 |
| Koreans | 96.2 /100 | #116 | Exceptional $48,727 |
| Serbians | 95.9 /100 | #117 | Exceptional $48,677 |
| Immigrants | Jordan | 95.9 /100 | #118 | Exceptional $48,673 |
| Poles | 95.8 /100 | #119 | Exceptional $48,659 |
| Carpatho Rusyns | 95.5 /100 | #120 | Exceptional $48,617 |
| Arabs | 95.4 /100 | #121 | Exceptional $48,599 |
Demographics Similar to Immigrants from Iraq by Median Earnings
In terms of median earnings, the demographic groups most similar to Immigrants from Iraq are Immigrants from Nigeria ($45,030, a difference of 0.090%), Native Hawaiian ($45,027, a difference of 0.090%), Scotch-Irish ($44,924, a difference of 0.14%), Immigrants from Western Africa ($44,893, a difference of 0.21%), and Immigrants from Cambodia ($45,090, a difference of 0.22%).
| Demographics | Rating | Rank | Median Earnings |
| Immigrants | Guyana | 15.1 /100 | #221 | Poor $45,204 |
| Immigrants | Panama | 15.0 /100 | #222 | Poor $45,198 |
| Whites/Caucasians | 15.0 /100 | #223 | Poor $45,197 |
| West Indians | 13.9 /100 | #224 | Poor $45,132 |
| Immigrants | Cambodia | 13.2 /100 | #225 | Poor $45,090 |
| Immigrants | Nigeria | 12.2 /100 | #226 | Poor $45,030 |
| Native Hawaiians | 12.2 /100 | #227 | Poor $45,027 |
| Immigrants | Iraq | 11.6 /100 | #228 | Poor $44,988 |
| Scotch-Irish | 10.7 /100 | #229 | Poor $44,924 |
| Immigrants | Western Africa | 10.3 /100 | #230 | Poor $44,893 |
| Japanese | 9.5 /100 | #231 | Tragic $44,825 |
| Delaware | 9.0 /100 | #232 | Tragic $44,783 |
| Immigrants | Sudan | 8.8 /100 | #233 | Tragic $44,767 |
| Cape Verdeans | 7.5 /100 | #234 | Tragic $44,640 |
| Venezuelans | 6.9 /100 | #235 | Tragic $44,580 |