Moroccan vs Immigrants from Italy 11th Grade

COMPARE

Moroccan
Race
Ancestry
AfghanAfricanAlaska NativeAlaskan AthabascanAlbanianAleutAlsatianAmericanApacheArabArapahoArgentineanArmenianAssyrian/Chaldean/SyriacAustralianAustrianBahamianBangladeshiBarbadianBasqueBelgianBelizeanBermudanBhutaneseBlackfeetBolivianBrazilianBritishBritish West IndianBulgarianBurmeseCajunCambodianCanadianCape VerdeanCarpatho RusynCelticCentral AmericanCentral American IndianCherokeeCheyenneChickasawChileanChineseChippewaChoctawColombianColvilleComancheCosta RicanCreeCreekCroatianCrowCubanCypriotCzechCzechoslovakianDanishDelawareDominicanDutchDutch West IndianEastern EuropeanEcuadorianEgyptianEnglishEstonianEthiopianEuropeanFijianFilipinoFinnishFrenchFrench American IndianFrench CanadianGermanGerman RussianGhanaianGreekGuamanian/ChamorroGuatemalanGuyaneseHaitianHmongHonduranHopiHoumaHungarianIcelanderIndian (Asian)IndonesianInupiatIranianIraqiIrishIroquoisIsraeliItalianJamaicanJapaneseJordanianKenyanKiowaKoreanLaotianLatvianLebaneseLiberianLithuanianLumbeeLuxembourgerMacedonianMalaysianMalteseMarshalleseMenomineeMexicanMexican American IndianMongolianMoroccanNative HawaiianNavajoNepaleseNew ZealanderNicaraguanNigerianNorthern EuropeanNorwegianOkinawanOsageOttawaPaiutePakistaniPalestinianPanamanianParaguayanPennsylvania GermanPeruvianPimaPolishPortuguesePotawatomiPuebloPuerto RicanPuget Sound SalishRomanianRussianSalvadoranSamoanScandinavianScotch-IrishScottishSeminoleSenegaleseSerbianShoshoneSierra LeoneanSiouxSlavicSlovakSloveneSomaliSouth AfricanSouth AmericanSouth American IndianSoviet UnionSpaniardSpanishSpanish AmericanSpanish American IndianSri LankanSubsaharan AfricanSudaneseSwedishSwissSyrianTaiwaneseThaiTlingit-HaidaTohono O'OdhamTonganTrinidadian and TobagonianTsimshianTurkishU.S. Virgin IslanderUgandanUkrainianUruguayanUteVenezuelanVietnameseWelshWest IndianYakamaYaquiYugoslavianYumanYup'ikZimbabwean
Immigration
NonimmigrantsImmigrantsAfghanistanAfricaAlbaniaArgentinaArmeniaAsiaAustraliaAustriaBahamasBangladeshBarbadosBelarusBelgiumBelizeBoliviaBosnia and HerzegovinaBrazilBulgariaBurma/MyanmarCabo VerdeCambodiaCameroonCanadaCaribbeanCentral AmericaChileChinaColombiaCongoCosta RicaCroatiaCubaCzechoslovakiaDenmarkDominicaDominican RepublicEastern AfricaEastern AsiaEastern EuropeEcuadorEgyptEl SalvadorEnglandEritreaEthiopiaEuropeFijiFranceGermanyGhanaGreeceGrenadaGuatemalaGuyanaHaitiHondurasHong KongHungaryIndiaIndonesiaIranIraqIrelandIsraelJamaicaJapanJordanKazakhstanKenyaKoreaKuwaitLaosLatin AmericaLatviaLebanonLiberiaLithuaniaMalaysiaMexicoMicronesiaMiddle AfricaMoldovaMoroccoNepalNetherlandsNicaraguaNigeriaNorth AmericaNorth MacedoniaNorthern AfricaNorthern EuropeNorwayOceaniaPakistanPanamaPeruPhilippinesPolandPortugalRomaniaRussiaSaudi ArabiaScotlandSenegalSerbiaSierra LeoneSingaporeSomaliaSouth AfricaSouth AmericaSouth Central AsiaSouth Eastern AsiaSouthern EuropeSpainSri LankaSt. Vincent and the GrenadinesSudanSwedenSwitzerlandSyriaTaiwanThailandTrinidad and TobagoTurkeyUgandaUkraineUruguayUzbekistanVenezuelaVietnamWest IndiesWestern AfricaWestern AsiaWestern EuropeYemenZaireZimbabweAzores
Immigrants from Italy
Race
Ancestry
AfghanAfricanAlaska NativeAlaskan AthabascanAlbanianAleutAlsatianAmericanApacheArabArapahoArgentineanArmenianAssyrian/Chaldean/SyriacAustralianAustrianBahamianBangladeshiBarbadianBasqueBelgianBelizeanBermudanBhutaneseBlackfeetBolivianBrazilianBritishBritish West IndianBulgarianBurmeseCajunCambodianCanadianCape VerdeanCarpatho RusynCelticCentral AmericanCentral American IndianCherokeeCheyenneChickasawChileanChineseChippewaChoctawColombianColvilleComancheCosta RicanCreeCreekCroatianCrowCubanCypriotCzechCzechoslovakianDanishDelawareDominicanDutchDutch West IndianEastern EuropeanEcuadorianEgyptianEnglishEstonianEthiopianEuropeanFijianFilipinoFinnishFrenchFrench American IndianFrench CanadianGermanGerman RussianGhanaianGreekGuamanian/ChamorroGuatemalanGuyaneseHaitianHmongHonduranHopiHoumaHungarianIcelanderIndian (Asian)IndonesianInupiatIranianIraqiIrishIroquoisIsraeliItalianJamaicanJapaneseJordanianKenyanKiowaKoreanLaotianLatvianLebaneseLiberianLithuanianLumbeeLuxembourgerMacedonianMalaysianMalteseMarshalleseMenomineeMexicanMexican American IndianMongolianNative HawaiianNavajoNepaleseNew ZealanderNicaraguanNigerianNorthern EuropeanNorwegianOkinawanOsageOttawaPaiutePakistaniPalestinianPanamanianParaguayanPennsylvania GermanPeruvianPimaPolishPortuguesePotawatomiPuebloPuerto RicanPuget Sound SalishRomanianRussianSalvadoranSamoanScandinavianScotch-IrishScottishSeminoleSenegaleseSerbianShoshoneSierra LeoneanSiouxSlavicSlovakSloveneSomaliSouth AfricanSouth AmericanSouth American IndianSoviet UnionSpaniardSpanishSpanish AmericanSpanish American IndianSri LankanSubsaharan AfricanSudaneseSwedishSwissSyrianTaiwaneseThaiTlingit-HaidaTohono O'OdhamTonganTrinidadian and TobagonianTsimshianTurkishU.S. Virgin IslanderUgandanUkrainianUruguayanUteVenezuelanVietnameseWelshWest IndianYakamaYaquiYugoslavianYumanYup'ikZimbabwean
Immigration
NonimmigrantsImmigrantsAfghanistanAfricaAlbaniaArgentinaArmeniaAsiaAustraliaAustriaBahamasBangladeshBarbadosBelarusBelgiumBelizeBoliviaBosnia and HerzegovinaBrazilBulgariaBurma/MyanmarCabo VerdeCambodiaCameroonCanadaCaribbeanCentral AmericaChileChinaColombiaCongoCosta RicaCroatiaCubaCzechoslovakiaDenmarkDominicaDominican RepublicEastern AfricaEastern AsiaEastern EuropeEcuadorEgyptEl SalvadorEnglandEritreaEthiopiaEuropeFijiFranceGermanyGhanaGreeceGrenadaGuatemalaGuyanaHaitiHondurasHong KongHungaryIndiaIndonesiaIranIraqIrelandIsraelItalyJamaicaJapanJordanKazakhstanKenyaKoreaKuwaitLaosLatin AmericaLatviaLebanonLiberiaLithuaniaMalaysiaMexicoMicronesiaMiddle AfricaMoldovaMoroccoNepalNetherlandsNicaraguaNigeriaNorth AmericaNorth MacedoniaNorthern AfricaNorthern EuropeNorwayOceaniaPakistanPanamaPeruPhilippinesPolandPortugalRomaniaRussiaSaudi ArabiaScotlandSenegalSerbiaSierra LeoneSingaporeSomaliaSouth AfricaSouth AmericaSouth Central AsiaSouth Eastern AsiaSouthern EuropeSpainSri LankaSt. Vincent and the GrenadinesSudanSwedenSwitzerlandSyriaTaiwanThailandTrinidad and TobagoTurkeyUgandaUkraineUruguayUzbekistanVenezuelaVietnamWest IndiesWestern AfricaWestern AsiaWestern EuropeYemenZaireZimbabweAzores
11th Grade
Income
Poverty
Unemployment
Labor Participation
Family Structure
Vehicle Availability
Education Level
Disability

11th Grade Comparison

Moroccans

Immigrants from Italy

Fair
Excellent
92.3%
11TH GRADE
28.7/ 100
METRIC RATING
193rd/ 347
METRIC RANK
92.9%
11TH GRADE
86.6/ 100
METRIC RATING
135th/ 347
METRIC RANK

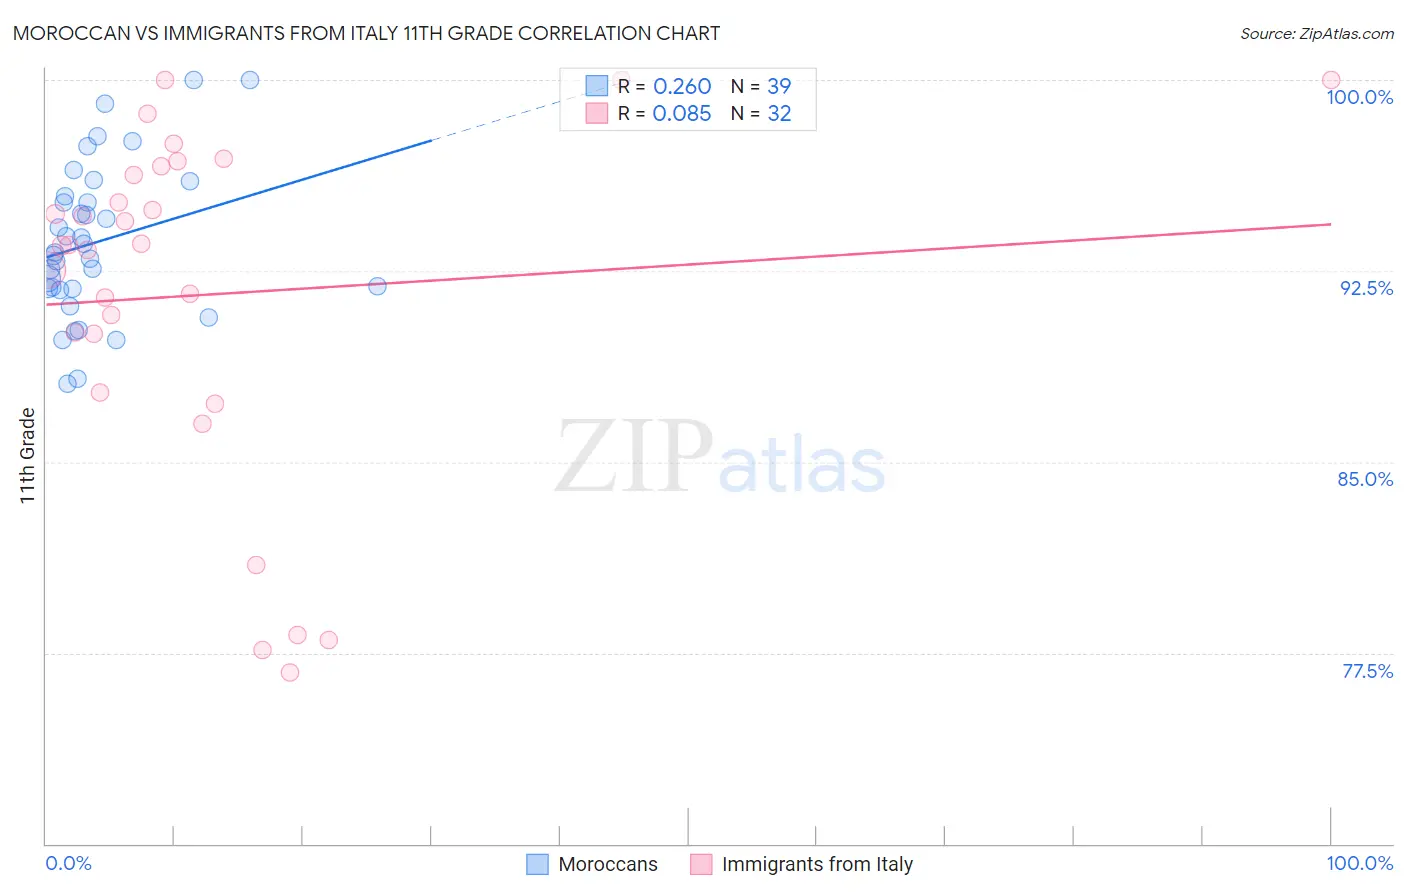
Moroccan vs Immigrants from Italy 11th Grade Correlation Chart

The statistical analysis conducted on geographies consisting of 201,817,667 people shows a weak positive correlation between the proportion of Moroccans and percentage of population with at least 11th grade education in the United States with a correlation coefficient (R) of 0.260 and weighted average of 92.3%. Similarly, the statistical analysis conducted on geographies consisting of 324,226,009 people shows a slight positive correlation between the proportion of Immigrants from Italy and percentage of population with at least 11th grade education in the United States with a correlation coefficient (R) of 0.085 and weighted average of 92.9%, a difference of 0.68%.
Moroccan vs Immigrants from Italy 11th Grade

11th Grade Correlation Summary

MeasurementMoroccanImmigrants from Italy
Minimum88.1%76.7%
Maximum100.0%100.0%
Range11.9%23.3%
Mean93.6%91.6%
Median93.2%93.5%
Interquartile 25% (IQ1)91.8%88.9%
Interquartile 75% (IQ3)95.4%96.5%
Interquartile Range (IQR)3.6%7.6%
Standard Deviation (Sample)3.0%6.8%
Standard Deviation (Population)3.0%6.7%

Similar Demographics by 11th Grade

Demographics Similar to Moroccans by 11th Grade

In terms of 11th grade, the demographic groups most similar to Moroccans are Sioux (92.3%, a difference of 0.0%), French American Indian (92.3%, a difference of 0.020%), Immigrants from Syria (92.3%, a difference of 0.020%), Liberian (92.3%, a difference of 0.020%), and Chickasaw (92.3%, a difference of 0.030%).
DemographicsRating | Rank11th Grade
Arapaho
35.1
/100
|
#186
Fair
92.4%
Immigrants | Western Asia
35.0
/100
|
#187
Fair
92.4%
Immigrants | Indonesia
33.7
/100
|
#188
Fair
92.4%
Immigrants | Chile
33.3
/100
|
#189
Fair
92.4%
Chickasaw
31.4
/100
|
#190
Fair
92.3%
French American Indians
30.8
/100
|
#191
Fair
92.3%
Immigrants | Syria
30.4
/100
|
#192
Fair
92.3%
Moroccans
28.7
/100
|
#193
Fair
92.3%
Sioux
28.5
/100
|
#194
Fair
92.3%
Liberians
26.8
/100
|
#195
Fair
92.3%
Panamanians
26.4
/100
|
#196
Fair
92.3%
Marshallese
26.0
/100
|
#197
Fair
92.3%
Hawaiians
25.5
/100
|
#198
Fair
92.3%
Immigrants | Uganda
25.2
/100
|
#199
Fair
92.3%
Samoans
25.1
/100
|
#200
Fair
92.3%

Demographics Similar to Immigrants from Italy by 11th Grade

In terms of 11th grade, the demographic groups most similar to Immigrants from Italy are Cree (92.9%, a difference of 0.010%), Mongolian (93.0%, a difference of 0.020%), Delaware (93.0%, a difference of 0.020%), Arab (92.9%, a difference of 0.020%), and Immigrants from Brazil (92.9%, a difference of 0.030%).
DemographicsRating | Rank11th Grade
Immigrants | Jordan
92.4
/100
|
#128
Exceptional
93.1%
Immigrants | Ukraine
89.8
/100
|
#129
Excellent
93.0%
Albanians
89.5
/100
|
#130
Excellent
93.0%
Egyptians
89.5
/100
|
#131
Excellent
93.0%
Immigrants | Bosnia and Herzegovina
89.0
/100
|
#132
Excellent
93.0%
Mongolians
87.6
/100
|
#133
Excellent
93.0%
Delaware
87.3
/100
|
#134
Excellent
93.0%
Immigrants | Italy
86.6
/100
|
#135
Excellent
92.9%
Cree
85.9
/100
|
#136
Excellent
92.9%
Arabs
85.4
/100
|
#137
Excellent
92.9%
Immigrants | Brazil
85.1
/100
|
#138
Excellent
92.9%
Crow
84.1
/100
|
#139
Excellent
92.9%
Venezuelans
83.4
/100
|
#140
Excellent
92.9%
Chileans
83.0
/100
|
#141
Excellent
92.9%
Kenyans
82.0
/100
|
#142
Excellent
92.9%