German vs Immigrants from Italy Median Earnings
COMPARE
German
Immigrants from Italy
Median Earnings
Median Earnings Comparison
Germans
Immigrants from Italy
$45,935
MEDIAN EARNINGS
33.2/ 100
METRIC RATING
192nd/ 347
METRIC RANK
$50,581
MEDIAN EARNINGS
99.7/ 100
METRIC RATING
76th/ 347
METRIC RANK
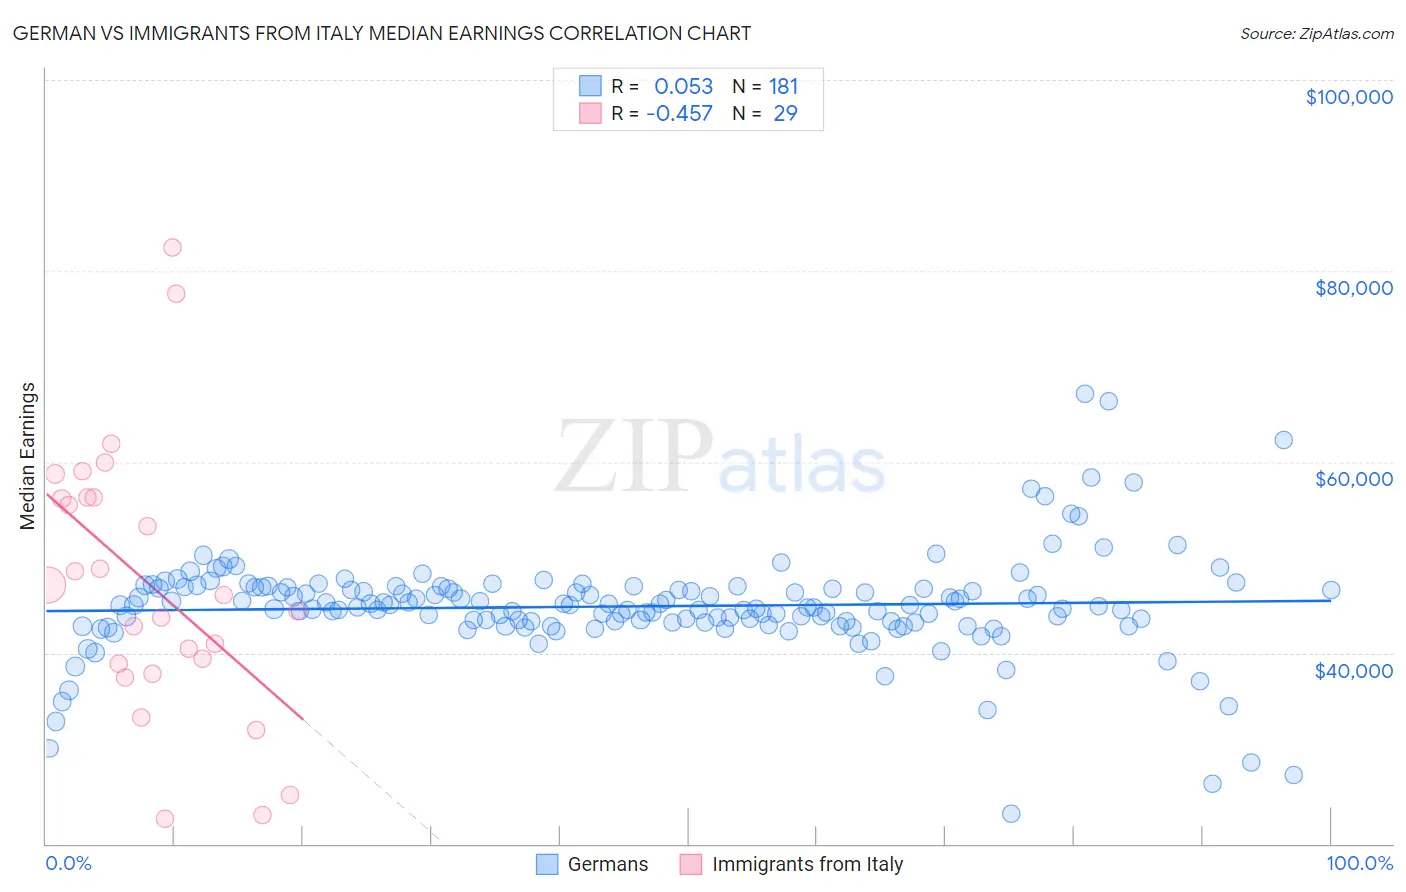
German vs Immigrants from Italy Median Earnings Correlation Chart
The statistical analysis conducted on geographies consisting of 580,480,068 people shows a slight positive correlation between the proportion of Germans and median earnings in the United States with a correlation coefficient (R) of 0.053 and weighted average of $45,935. Similarly, the statistical analysis conducted on geographies consisting of 324,208,754 people shows a moderate negative correlation between the proportion of Immigrants from Italy and median earnings in the United States with a correlation coefficient (R) of -0.457 and weighted average of $50,581, a difference of 10.1%.
Median Earnings Correlation Summary
| Measurement | German | Immigrants from Italy |
| Minimum | $23,082 | $22,656 |
| Maximum | $67,100 | $82,450 |
| Range | $44,018 | $59,794 |
| Mean | $44,861 | $47,205 |
| Median | $44,941 | $46,000 |
| Interquartile 25% (IQ1) | $43,214 | $38,371 |
| Interquartile 75% (IQ3) | $46,790 | $56,217 |
| Interquartile Range (IQR) | $3,576 | $17,846 |
| Standard Deviation (Sample) | $5,408 | $14,283 |
| Standard Deviation (Population) | $5,393 | $14,035 |
Similar Demographics by Median Earnings
Demographics Similar to Germans by Median Earnings
In terms of median earnings, the demographic groups most similar to Germans are Guamanian/Chamorro ($45,933, a difference of 0.0%), Finnish ($45,940, a difference of 0.010%), Immigrants from Costa Rica ($45,928, a difference of 0.020%), Immigrants from St. Vincent and the Grenadines ($45,908, a difference of 0.060%), and Yugoslavian ($45,846, a difference of 0.19%).
| Demographics | Rating | Rank | Median Earnings |
| Uruguayans | 41.6 /100 | #185 | Average $46,190 |
| Vietnamese | 40.9 /100 | #186 | Average $46,172 |
| Iraqis | 39.9 /100 | #187 | Fair $46,140 |
| Immigrants | Armenia | 38.3 /100 | #188 | Fair $46,094 |
| Spaniards | 37.2 /100 | #189 | Fair $46,059 |
| French Canadians | 36.1 /100 | #190 | Fair $46,026 |
| Finns | 33.4 /100 | #191 | Fair $45,940 |
| Germans | 33.2 /100 | #192 | Fair $45,935 |
| Guamanians/Chamorros | 33.2 /100 | #193 | Fair $45,933 |
| Immigrants | Costa Rica | 33.0 /100 | #194 | Fair $45,928 |
| Immigrants | St. Vincent and the Grenadines | 32.4 /100 | #195 | Fair $45,908 |
| Yugoslavians | 30.5 /100 | #196 | Fair $45,846 |
| Barbadians | 30.5 /100 | #197 | Fair $45,846 |
| Trinidadians and Tobagonians | 29.7 /100 | #198 | Fair $45,820 |
| Immigrants | Barbados | 29.6 /100 | #199 | Fair $45,816 |
Demographics Similar to Immigrants from Italy by Median Earnings
In terms of median earnings, the demographic groups most similar to Immigrants from Italy are Immigrants from Western Europe ($50,549, a difference of 0.060%), Immigrants from Scotland ($50,741, a difference of 0.32%), South African ($50,752, a difference of 0.34%), Argentinean ($50,399, a difference of 0.36%), and Immigrants from Netherlands ($50,818, a difference of 0.47%).
| Demographics | Rating | Rank | Median Earnings |
| Mongolians | 99.8 /100 | #69 | Exceptional $51,038 |
| Lithuanians | 99.8 /100 | #70 | Exceptional $50,991 |
| Immigrants | Ukraine | 99.8 /100 | #71 | Exceptional $50,984 |
| Immigrants | Egypt | 99.8 /100 | #72 | Exceptional $50,901 |
| Immigrants | Netherlands | 99.8 /100 | #73 | Exceptional $50,818 |
| South Africans | 99.8 /100 | #74 | Exceptional $50,752 |
| Immigrants | Scotland | 99.8 /100 | #75 | Exceptional $50,741 |
| Immigrants | Italy | 99.7 /100 | #76 | Exceptional $50,581 |
| Immigrants | Western Europe | 99.7 /100 | #77 | Exceptional $50,549 |
| Argentineans | 99.6 /100 | #78 | Exceptional $50,399 |
| Laotians | 99.6 /100 | #79 | Exceptional $50,343 |
| Ukrainians | 99.6 /100 | #80 | Exceptional $50,320 |
| Immigrants | Southern Europe | 99.6 /100 | #81 | Exceptional $50,280 |
| Immigrants | Moldova | 99.5 /100 | #82 | Exceptional $50,274 |
| Romanians | 99.5 /100 | #83 | Exceptional $50,244 |