Immigrants from Laos vs Armenian Median Female Earnings
COMPARE
Immigrants from Laos
Armenian
Median Female Earnings
Median Female Earnings Comparison
Immigrants from Laos
Armenians
$36,841
MEDIAN FEMALE EARNINGS
0.3/ 100
METRIC RATING
273rd/ 347
METRIC RANK
$42,212
MEDIAN FEMALE EARNINGS
99.5/ 100
METRIC RATING
84th/ 347
METRIC RANK
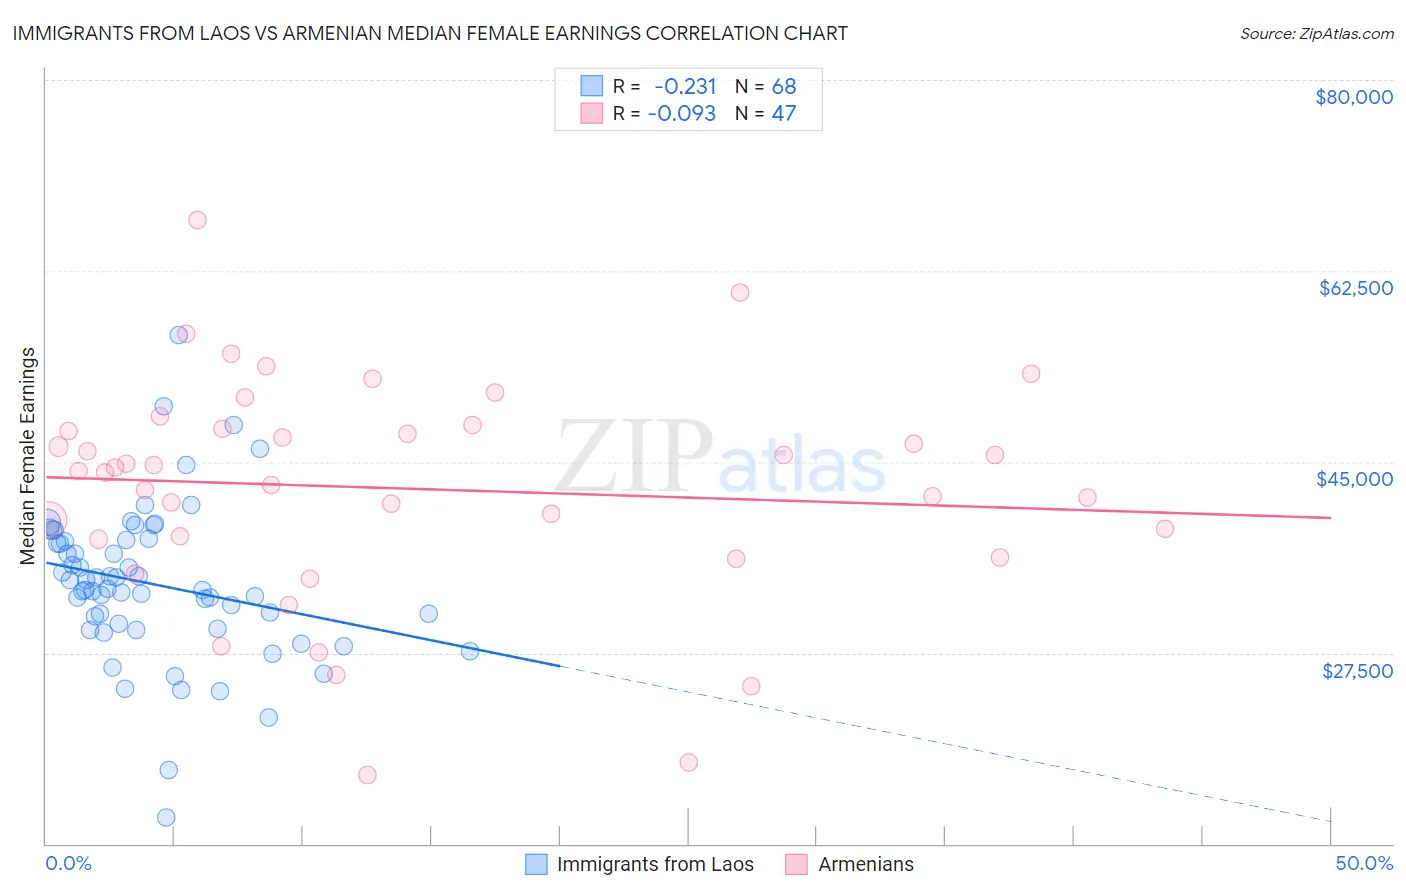
Immigrants from Laos vs Armenian Median Female Earnings Correlation Chart
The statistical analysis conducted on geographies consisting of 201,447,053 people shows a weak negative correlation between the proportion of Immigrants from Laos and median female earnings in the United States with a correlation coefficient (R) of -0.231 and weighted average of $36,841. Similarly, the statistical analysis conducted on geographies consisting of 310,826,336 people shows a slight negative correlation between the proportion of Armenians and median female earnings in the United States with a correlation coefficient (R) of -0.093 and weighted average of $42,212, a difference of 14.6%.
Median Female Earnings Correlation Summary
| Measurement | Immigrants from Laos | Armenian |
| Minimum | $12,451 | $16,250 |
| Maximum | $56,635 | $67,117 |
| Range | $44,184 | $50,867 |
| Mean | $33,796 | $42,561 |
| Median | $33,308 | $44,186 |
| Interquartile 25% (IQ1) | $29,977 | $37,899 |
| Interquartile 75% (IQ3) | $37,781 | $48,091 |
| Interquartile Range (IQR) | $7,803 | $10,192 |
| Standard Deviation (Sample) | $7,087 | $10,212 |
| Standard Deviation (Population) | $7,035 | $10,102 |
Similar Demographics by Median Female Earnings
Demographics Similar to Immigrants from Laos by Median Female Earnings
In terms of median female earnings, the demographic groups most similar to Immigrants from Laos are Immigrants from Dominican Republic ($36,857, a difference of 0.040%), Nicaraguan ($36,904, a difference of 0.17%), French American Indian ($36,920, a difference of 0.21%), Immigrants from Venezuela ($37,003, a difference of 0.44%), and Immigrants from El Salvador ($36,673, a difference of 0.46%).
| Demographics | Rating | Rank | Median Female Earnings |
| Dominicans | 0.4 /100 | #266 | Tragic $37,046 |
| Immigrants | Nonimmigrants | 0.4 /100 | #267 | Tragic $37,024 |
| Cree | 0.4 /100 | #268 | Tragic $37,018 |
| Immigrants | Venezuela | 0.4 /100 | #269 | Tragic $37,003 |
| French American Indians | 0.3 /100 | #270 | Tragic $36,920 |
| Nicaraguans | 0.3 /100 | #271 | Tragic $36,904 |
| Immigrants | Dominican Republic | 0.3 /100 | #272 | Tragic $36,857 |
| Immigrants | Laos | 0.3 /100 | #273 | Tragic $36,841 |
| Immigrants | El Salvador | 0.2 /100 | #274 | Tragic $36,673 |
| Africans | 0.1 /100 | #275 | Tragic $36,530 |
| Central Americans | 0.1 /100 | #276 | Tragic $36,492 |
| Marshallese | 0.1 /100 | #277 | Tragic $36,459 |
| U.S. Virgin Islanders | 0.1 /100 | #278 | Tragic $36,424 |
| Immigrants | Caribbean | 0.1 /100 | #279 | Tragic $36,414 |
| Iroquois | 0.1 /100 | #280 | Tragic $36,408 |
Demographics Similar to Armenians by Median Female Earnings
In terms of median female earnings, the demographic groups most similar to Armenians are Immigrants from Sierra Leone ($42,214, a difference of 0.010%), Immigrants from Morocco ($42,229, a difference of 0.040%), Immigrants from Southern Europe ($42,275, a difference of 0.15%), Laotian ($42,133, a difference of 0.19%), and Immigrants from Moldova ($42,304, a difference of 0.22%).
| Demographics | Rating | Rank | Median Female Earnings |
| Immigrants | Albania | 99.6 /100 | #77 | Exceptional $42,388 |
| Immigrants | Kazakhstan | 99.6 /100 | #78 | Exceptional $42,386 |
| Greeks | 99.6 /100 | #79 | Exceptional $42,336 |
| Immigrants | Moldova | 99.6 /100 | #80 | Exceptional $42,304 |
| Immigrants | Southern Europe | 99.5 /100 | #81 | Exceptional $42,275 |
| Immigrants | Morocco | 99.5 /100 | #82 | Exceptional $42,229 |
| Immigrants | Sierra Leone | 99.5 /100 | #83 | Exceptional $42,214 |
| Armenians | 99.5 /100 | #84 | Exceptional $42,212 |
| Laotians | 99.4 /100 | #85 | Exceptional $42,133 |
| Immigrants | St. Vincent and the Grenadines | 99.3 /100 | #86 | Exceptional $42,108 |
| Lithuanians | 99.3 /100 | #87 | Exceptional $42,108 |
| Immigrants | Northern Africa | 99.3 /100 | #88 | Exceptional $42,084 |
| Immigrants | Afghanistan | 99.3 /100 | #89 | Exceptional $42,055 |
| Ukrainians | 99.2 /100 | #90 | Exceptional $42,015 |
| Immigrants | Western Europe | 99.2 /100 | #91 | Exceptional $41,990 |